
Introduction
State of Good Repair & Resilience (SGR)
Vision Zero
Smart Cities
Real Choices When Not Driving
Performance Based Planning and Programming
Introduction
Introduction to the 2021 Data
The State of the System report shows how our transportation system has performed in recent years, and whether we have made progress toward achieving our goals and federally reported targets. The data have been collected from several sources that date to 2010, and from the FDOT Work Program and Capital Improvement Programs (CIPs) of the jurisdictions to report the current spending trends from FY2021 through FY2026.
In the three years since the previous State of the System report was published, this region served as a destination for several major events. Notably, the City of Tampa hosted both a Super Bowl & Stanley Cup championship and events. These celebrations brought visitors and allowed our traffic management systems to test route diversion plans and communication strategies with travelers.
Also during this reporting period, the COVID-19 pandemic caused one of the most significant disruptions to travel patterns in the past several decades. It dramatically impacted the ways that we travel, commute, and engage in recreational activities like walking or biking. As the pandemic raged on in the spring and summer of 2020 and health measures restricted travel, vehicle miles traveled (VMT) in Hillsborough County decreased by nearly 20%. The decrease reversed a decade-long trend of increasing VMT, which averaged approximately +3% annually since 2010, outpacing the population growth rate of 2.3% over the same period. More recent travel trends from FHWA indicate that the VMT growth has returned, increasing by almost 8% nationally, and almost by 9% in the Southeast region, in September 2021 compared to that in September 2020. It is also estimated that VMT will increase to the pre-COVID levels by the end of this year. In the context of transportation performance tracking, nearly all measures must be contextualized against the backdrop of the unusually low VMT during this reporting period as a result of travel restrictions, supply chain disruptions, and the increase of telecommuting.
Growth Trends
Since 2018, Hillsborough County has added approximately 61,000 people to its already sizable population. While this number might seem large to some, the rate of growth over this three-year period (1.3%) was actually the lowest that it has been since the Great Recession of 2007-09. Unless otherwise noted, this report’s per capita performance measures are calculated using the most recent population data from the Census American Community Survey, which is 1,459,762 residents.
Looking ahead, the 2045 Population and Employment map (Figure 1) shows the areas experiencing the most growth and development and indicates where people will mostly likely live and work in the future. These projections give us an idea of where investments need to be focused to meet demand.
Figure 1: 2045 Population and Employment Density
State of Good Repair & Resilience (SGR)
The SGR performance measures evaluate the condition of pavement, bridge, and transit assets, as well as stormwater & drainage. Maintaining the assets that we already own represents the single greatest need and expense across the county. With more than 12,000 lane miles, 862 bridges and more than 200 buses, ensuring that these assets do not fall into a state of disrepair is a critical need.
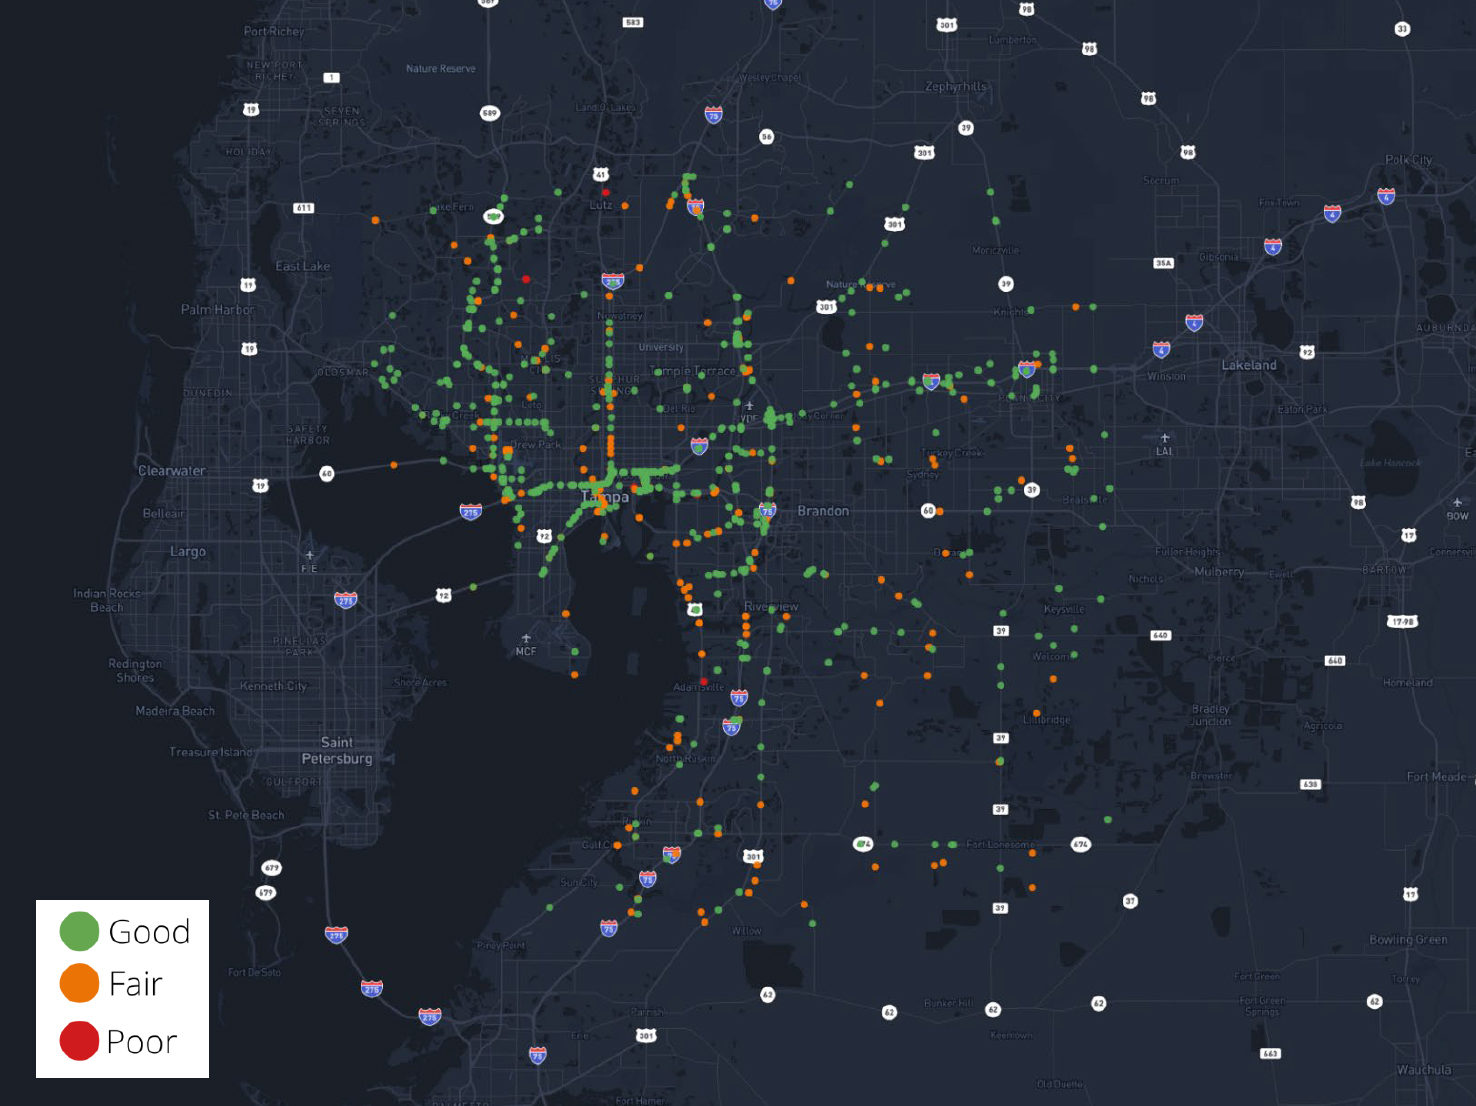
Pavement Condition
Hillsborough County has more than 12,000 lane miles of pavement divided among the unincorporated County (62%) Tampa Hillsborough Expressway Authority (THEA) (1%), FDOT (11%) and the cities of Tampa (22%), Plant City (3%) and Temple Terrace (1%). Quality of pavement is measured using a Pavement Condition Index (PCI) scale ranging from 0-100. Hillsborough County has categorized the PCI values into 4 categories, 0-25, 26-55, 56-85 and 86-100, with the higher range indicating a good pavement. While each jurisdiction has its own PCI goals, this scale is an objective classification of quality of the pavement. The LRTP has set a broad goal to repave the major roads once every 17 years, yet only about 60% of the roads will be able to be resurfaced in this timeframe with the current levels.
The 11% of lane-miles in our county boundary maintained by FDOT include both State Roads and the National Highway System (NHS). The federal government requires monitoring of the NHS roads in two groupings: Interstate and Non-Interstate. NHS pavement condition in Hillsborough County is currently as follows:
- Percentage of Interstate roads in good condition is 59.5% (while statewide it is 68.5%)
- Percentage of Interstate roads in poor condition is 0.3% (statewide 0.3%)
- Percentage of Non-Interstate NHS roads in good condition is 36.3% (statewide 41%)
- Percentage of Non-Interstate NHS roads in poor condition is 0.1% (statewide 0.2%)
Hillsborough’s percent of Interstate and Non-Interstate NHS pavement in good condition lags behind our peers in the Tampa Bay Region (Pasco 95% and 58%; Pinellas 67% and 41%; Sarasota 94% and 34%) and the percentages narrowly fail to meet the TPO’s 2018 Pavement Performance Measures target.


A majority of the lane-miles inside our county boundary are maintained by Hillsborough County, about 7,250 lane miles, and more than one-third of these are on major roads. With such a staggering inventory of pavement to maintain, the need is rapidly outpacing the annual funding commitment. Though today 18% of the major roads and 26% of the local roads are in poor or worse condition, that percentage is expected to rise to 65% and 79% respectively by 2030 if a more sustainable funding source for good repair does not become available. Recent estimates show that by 2031, the need is projected to be 10 times higher than available funding.
Bridge Condition
The National Bridge Inventory is a dataset containing inspection results for all 819 bridges in Hillsborough County for 2021. Of the 819, 646 (76% of the bridges) were reported to be in good condition and only 4 (1%) of the bridges were found to be in poor condition. The Hillsborough County Bridge Condition is shown here.
Of these bridges, 491 are NHS structures, with 420 (86%) rated in good condition and 0% poor. On average, NHS bridges in Hillsborough County stand in a better condition than in other parts of Florida. The chart showing the bridge condition for all the bridges in Hillsborough County is shown here. Further, this performance greatly exceeds the TPO’s target to have more than 50% of NHS bridges in good and less than 10% in poor condition.
Hillsborough County owns the next largest share of bridges, reporting on 275 structures, of which 249 are rated on the National Bridge Inventory. The County reports that as of 2021, about 72% of its bridges are in good condition They are maintained with approximately $2 million each year, and unless funding increases to an estimated $12 million annually, the number of bridges in good condition is projected to drop to just 9% by 2030. Unfortunately, without timely attention to bridges falling into fair condition, costs mushroom quickly. The 2045 Long Range Transportation Plan (LRTP) found that the average cost for a major bridge rehab is $5.2 million while the average for minor repairs is just $122,000.
Transit Assets
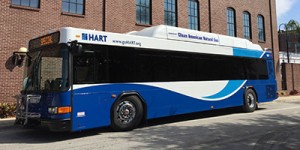
HART provides transit service across 255 square miles within the county and to approximately 810,000 people. The HART fleet includes fixed-route buses, paratransit vans and streetcars.
The 2020 HART fleet plan shows that 31 fixed-route buses, 21 paratransit vans, no streetcars, and 9 non-revenue vehicles have met their useful life and are now ready for retirement. It also indicates that about 41% of vehicles are not in a state of good repair. The 2045 LRTP estimates that if HART buses were replaced on time, the number of bus service calls/ breakdowns on the road could be reduced by about half.
The Federal Transit Administration recommends that heavy-duty large buses reach a minimum of 12 years or 500,000 miles before retirement to ensure the effective use of federally funded assets. HART buses typically accumulate 60% more than that, or approximately 800,000 miles before retirement from service.
According to the 2021 HART Budget report, 58 paratransit vans were purchased over the last two years to replace aging vehicles, which represents about half of the van fleet. Currently, the average van age is 1.5 years.
Resilience
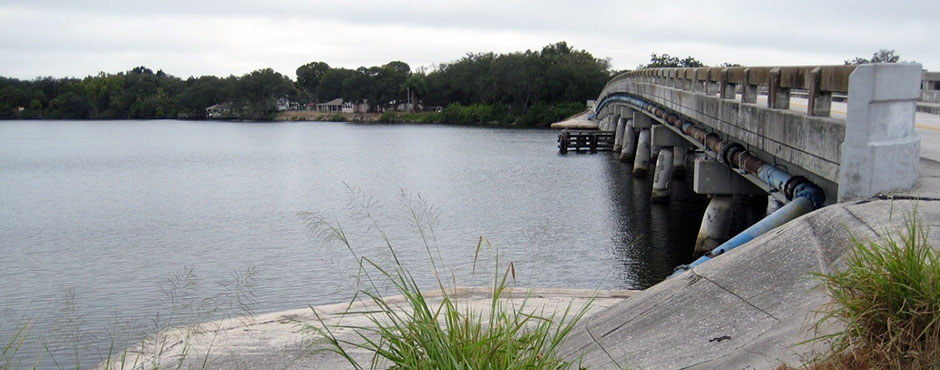
About 20% of the major road network in Hillsborough County is vulnerable to inundation from a Category 3 hurricane’s storm surge. Another 11% is vulnerable to inland flooding as a result of severe rainfall events, defined as 9″ of rain or more in 24 hours. Both types of severe weather events are becoming more common due to climate change. Because of these trends, when bridges are rebuilt, the new structures are frequently higher; for example, FDOT design standards for coastal bridges call for superstructure to be a minimum of one foot above 100-year wave crest including storm surge and wind. However, even as bridge structures are rebuilt, the waterway crossing may remain vulnerable because of low-lying causeways leading up to the bridge.
Our roads’ vulnerability may make them impassible not only while the waters are high, but afterwards as well, if the waters scour and erode the ground and any structures on which the roads depend. Roads remaining impassible after a severe storm event will hinder recovery efforts as well as reconstruction. The TPO’s Resilient Tampa Bay study identified 115 miles of critical road segments that are highly or moderately vulnerable and estimated that the economic impact of these roads remaining impassible for only 2½ weeks would outweigh the cost of investing in resilience now.
Resilience investments include expanding and improving stormwater drainage systems, hardening the pavement and sub-base of roads, strengthening the shoreline, and adding breakwaters to reduce wave impact along coastal roads, and even raising the profile of some roads. These investments are most cost-effective when included in regular road or bridge maintenance activities. The 2045 LRTP estimated that including such investments in the local and state governments’ good repair programs would require increasing the budget for stormwater systems by about half and nearly doubling the budget for resurfacing projects.
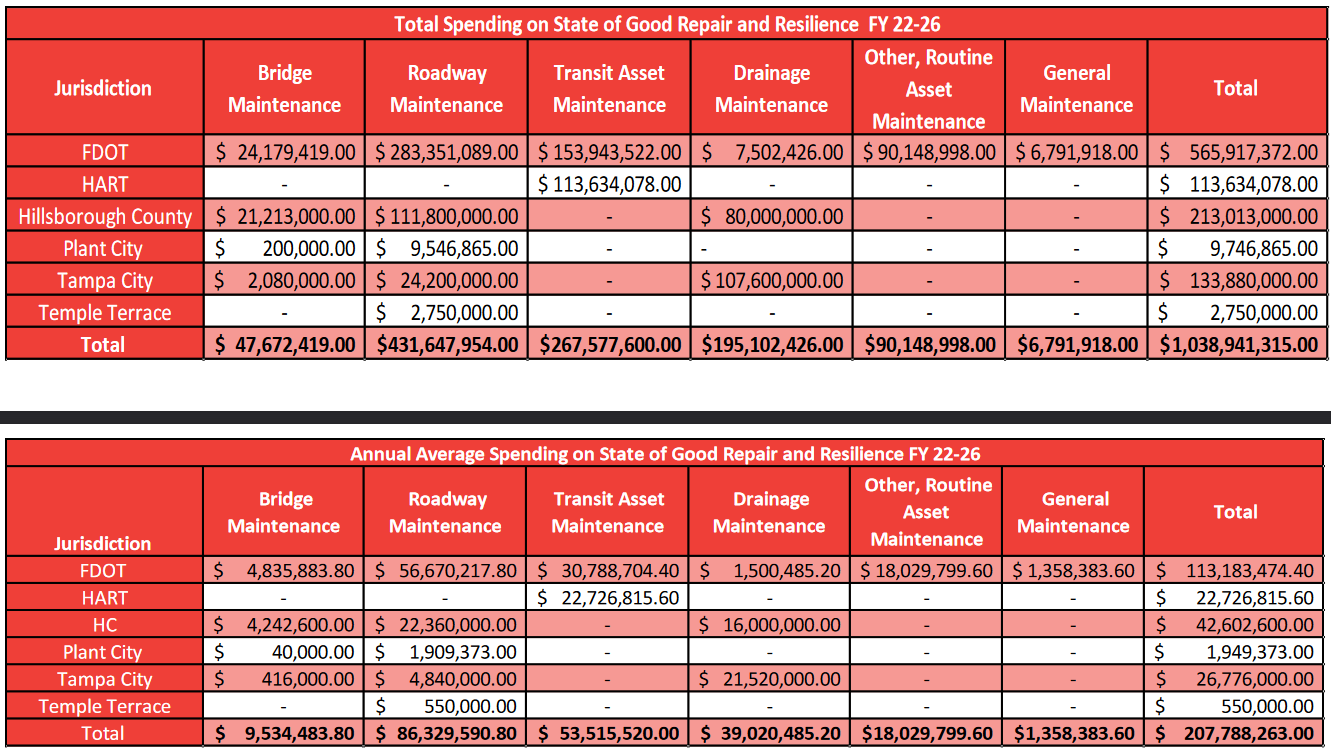
Spending on State of Good Repair and Resilience
Investing in pavement, bridges, and transit to preserve existing assets is the TPO’s top priority. These investments are critical to ensuring a safe and efficient transportation system that is both resilient and reliable. In total, the jurisdictions across the county have allocated nearly $48 million for bridge rehabs and repairs as shown here, and $432 million for pavement maintenance over the next 5 years, shown here. In addition, the City of Tampa, Hillsborough County and the State have allocated roughly $195 million for maintaining stormwater and drainage systems. In combination, FDOT and HART have allocated nearly $268 million toward maintaining transit assets and repairing/replacing vehicles for the next 5 years. In addition to this, FDOT allocates money for general maintenance work including minor electrical and lighting repairs which totals to approximately $19 million each year. This means all the jurisdictions within Hillsborough County have allocated over $1 billion or approximately $208 million annually for the next 5 years for all maintenance projects which include roads, bridges, transit maintenance and other general structural maintenance. A detailed breakdown of spending by each jurisdiction in this category can be found here.
Vision Zero
Vision Zero refers to a vision of zero traffic deaths for all road users, including drivers, pedestrians, and bicyclists. In the past few decades, driver and passenger death rates have declined with the implementation of vehicle safety features and on-road improvements such as guardrails, while pedestrian and bicyclist deaths have grown.
One of the biggest impacts of the COVID-19 pandemic on traffic safety was the national trend of fewer vehicles on state highways and arterials and, as a result, much faster average speeds. Data collected from red-light cameras that monitor drivers reported a 7% increase in speed during April 2020, when there were lockdown orders and travel restrictions in the Tampa Bay area. As reported by the FHWA, although the pandemic generated a nationwide reduction in VMT in 2020, the number of deaths did not decrease proportionately. The resulting fatality rates were considerably higher, which is likely attributable to the increase in travel speeds. While 2020 was an unusual year, 2021 has thus far shown a concerning number of crashes and fatalities across the county.
Traffic Crashes reported are based on the crash reports collected from the law enforcement to the Florida Highway Safety Motor Vehicles (FLHSMV) and are updated frequently. According to the data collected from the FLHSMV in early December of this year, there have been over 25,000 crashes in the Hillsborough County boundaries with over 200 fatalities since the beginning of 2021. Unfortunately, these numbers are higher than the previous year, at the same time that traffic appears to be returning to pre-COVID levels.
- Number of Fatalities: In 2019, Hillsborough County suffered from another year of exceptionally high traffic fatalities (218). At the outset of the pandemic in 2020, and as Annual Average Daily Traffic (AADT) decreased by as much as 20%, we witnessed a slight decrease in the number of fatal crashes through the first 6-8 months of that year; but it picked up in the last quarter of 2020. Unfortunately, from the beginning of 2021 through the end of November, FLHSMV reports that there have already been over 200 fatalities. The number of fatalities reported from 2018-2021 can be found here.
- Rate of fatalities: The rate of fatalities is the total number of fatalities per 100 million Vehicle Miles Traveled (MVMT) over a five-year period. The average rate of fatalities from 2018-2020 was 1.42. To meet the performance target set by the TPO, the rate would need to drop to 38 or lower for the 2017-2021 period.
- Number of serious injuries: The number of serious injuries is calculated as the total number of crashes with at least one person with a serious injury during a calendar year. The number of serious injuries has continued to drop in the last 3 years since 2018 as shown on the chart. During the period from 2018-2020, the average annual number of crashes with serious injuries was 1,176, which is lower than the TPO adopted target for 2021 (five-year rolling average) of 1,201.
- Rate of serious injuries: The rate of serious injury crashes is calculated as the total number of serious injury crashes per 100 MVMT in a calendar year. The rate of serious injury crashes during the period from 2018-2020 was 8.48 and is anticipated to be 7.26 for 2021. If the trend holds, then this will be better than the TPO adopted target (five-year rolling average) of 49.
- Number of non-motorized crashes with serious injuries and fatalities: Since the last reporting period, the average number of non-motorized (for example, walking and bicycling) fatal and injury crashes has increased significantly, with over 220 crashes reported in 2020, and almost the same number reported since the beginning of this year as shown here. This is higher than the previous years, which could be attributed to more people cycling and walking for recreation, in the context of pandemic travel restrictions. The TPO’s target is for the five year rolling average number of annual crashes to be below 230 by the end of 2021.
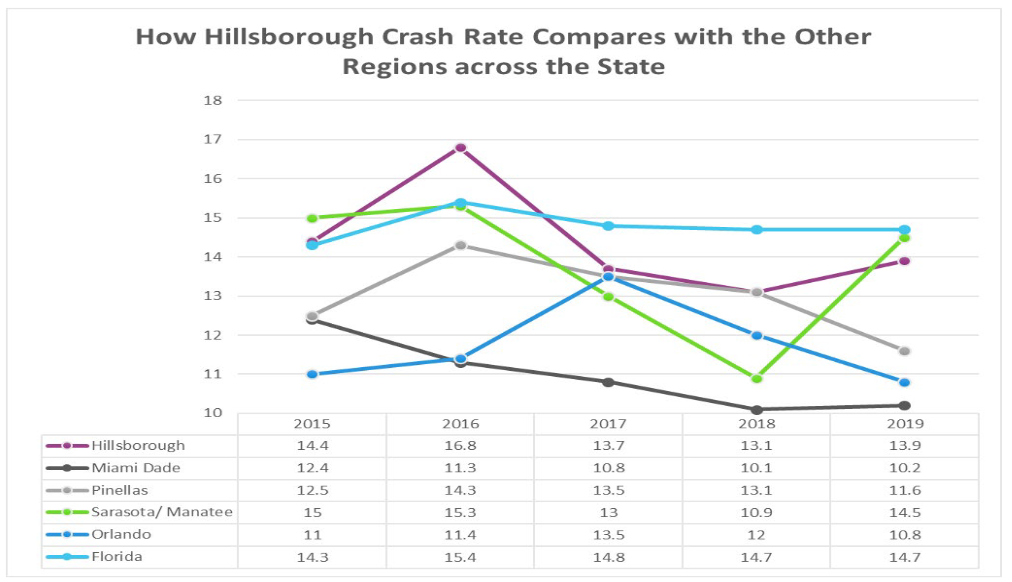
Our peer counties in Florida reported a dip in crashes and crash rates in 2018 and then an increase in 2019. A comparison chart between Hillsborough County and other peer metros can be found here.
Transit Safety
In 2021, the TPO adopted Public Transportation Agency Safety Plan (PTASP) targets for the first time. Transit safety performance garnered much attention in 2019 following a tragic incident in which a passenger fatally stabbed a HART bus driver. This incident prompted HART to implement numerous security measures. In the time since, HART has invested more than $1 million to install plexiglass barriers on 180 buses and 12 HARTFlex vans. HART reports an average of less than 6 safety events per 100,000 revenue miles, which is less than the adopted PTASP targets for this year.
![]()
Spending on Vision Zero
To accomplish the goals of the Vision Zero program, the 2045 LRTP identified a bundle of improvements with documented safety benefits for all road users, referred to generically as Complete Streets improvements. The analysis done for the LRTP indicated that additional funding equivalent to a 1-cent sales tax invested in safety projects could reduce crashes by an additional 35% by 2045; and that in the absence of that funding, crashes could be reduced by about ten percent with the trend spending of $18 million per year. Though the amount of funding for safety is not close to the $65 million per year needed for a 35% reduction, we are pleased to report that $132 million has been programmed over the next five years by all the jurisdictions in Hillsborough County, which amounts to almost $27 million annually. The detailed spending by the jurisdictions within Hillsborough County is shown below.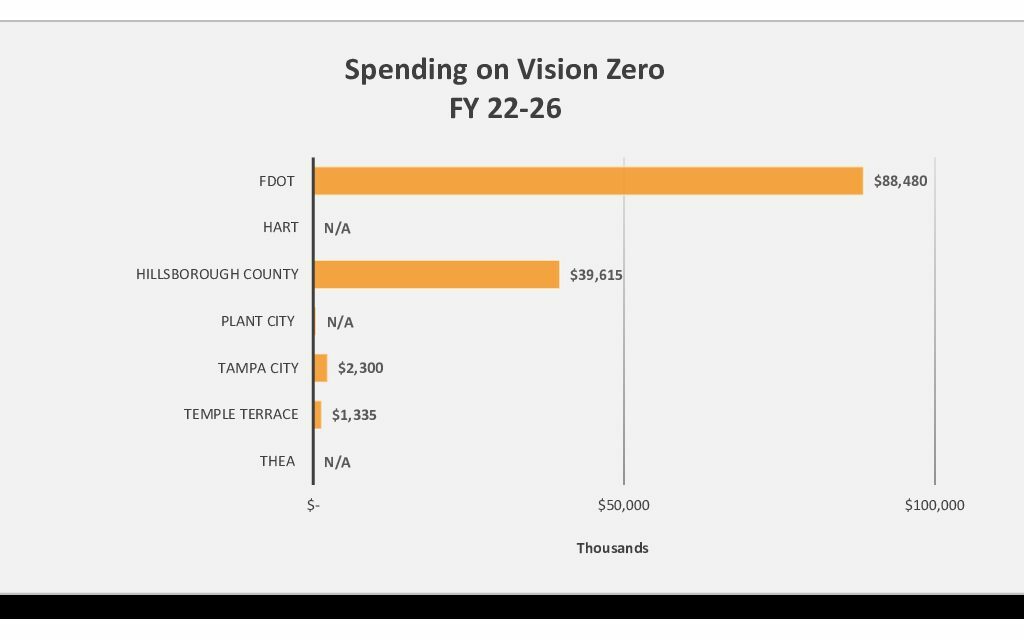
Smart Cities
The focus of the Smart Cities program is to make use of operational strategies, traffic management systems, and technologies to improve traffic flow, Travel Time Reliability and air quality.
Travel Data
According to FDOT, the total daily vehicle delay for National Highway System (NHS) roads in Hillsborough County in 2019 was 48,700 hours; and Vehicle Miles Traveled (VMT) were 21.9 million miles in 2019. This dropped to 19.4 million miles in 2020, accounting for about 11% reduction. The reduction in travel in the beginning of 2020 owing to the travel restrictions due to COVID-19 pandemic picked up towards the end of the year. People were limiting their travel to local destinations, especially within Florida. Data collected from FDOT’s Highway Mileage and Travel, and the American Community Survey indicate that the VMT greatly dropped in 2020. The Annual Daily Vehicle Miles traveled in all Hillsborough County roads for 2020 was 36.3 million miles, which was a 10% drop compared to the previous year. Pandemic travel restrictions and the decision by many to work from home caused the daily average VMT to drop to 13.26 miles per person per day in 2020. The State Highway System (SHS) VMT also declined, from 15.6 to 13.9 in 2020. VMT on all public roads in Hillsborough County followed a similar trend, dropping from 27.4 miles per person per day in 2019 to 24.9 in 2020, illustrated here.
One research study from 2020 indicates that more than half of all American workers wish to telecommute after the pandemic ends, although there has been an increase in vehicle miles traveled through September 2021 nearing pre-pandemic levels, according to the Federal Highway Administration (FHWA) Traffic Volume Trend report. This possibly indicates a shift in travel trends, where there has been a rise in travel for non-commuting purposes.
The mean travel time to work reported from Census data for 2019 was 27.5 minutes, which has increased by about 7% over the last 5 years. The increase may or may not indicate increased delay experienced by travelers; another cause could be people moving farther away from their workplaces and tolerating a longer commute, as housing prices have increased over the same time period.
Travel Time Reliability
Travel Time Reliability (TTR) is a measure of how frequently the traffic is unpredictable. While some traffic congestion in major metro areas like Tampa Bay is inevitable, occasional severe spikes in delay are disruptive, creating unexpected costs for shippers, service people, and others who are depending on being able to adhere to a schedule. In this section, reliability means that four out of five weekdays, the travel time stays less than 50% longer at peak hour than at off-peak.
Interstate reliability: speed data collected for 2019 show that interstate highways were 89% reliable during AM peak hour and 66% reliable during the PM peak hour. As of 2020, overall travel times on the interstate are reliable in Hillsborough County 75% of the time. This performance meets the TPO’s target for system reliability precisely.
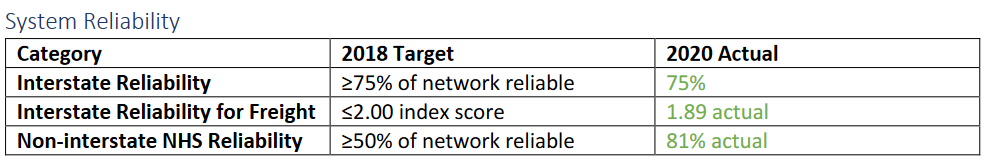
Non-interstate reliability: The non-interstate NHS roads comprise a greater proportion of roads in Hillsborough County than interstates. For this reason, non-interstate NHS may be a better indicator of overall performance than interstate reliability. Speed data obtained from 2019 report indicated that the non-interstate highways were reliable for almost 89% of the time during AM peak hour, and 77% during PM peak hour. In 2020, non-interstate NHS roads were considered reliable about 81% of the time, which greatly exceeds the TPO’s adopted target of 50% as reported by FDOT.
Truck Travel Time Reliability
The Truck Travel Time Reliability (TTTR) Index is the metric used to assess truck movement reliability on the NHS, and is a tougher standard, evaluating the level of unpredictability one day out of twenty, as opposed to one day out of five. HERE data show that Hillsborough County has a TTTR of 1.89, which means that on the worst travel days, the average truck trip takes 89% longer than usual. This performance achieves the TPO target of score 2.00 or less.
Air Quality
Vehicular air pollution is a direct outcome of traffic volume and congestion, and is a public health threat in almost every urbanized area across the US. National air quality standards are monitored at the state and local levels by the Florida Department of Environmental Protection and the Environmental Protection Commission of Hillsborough County (EPC), which produce some data to assess the condition of our air. Air Quality Index Report is the standard matrix for measuring the quality of air at a location with a value ranging from 0-500. The higher the number, the greater the level of air pollution and a greater health concern. Poor air quality generally poses a greater risk for people with asthma and other underlying health conditions. According to the Environmental Protection Agency (EPA), Hillsborough County and Florida, in general, are currently in attainment with the National Ambient Air Quality Standards (NAAQS). In 2021, Hillsborough County experienced 74% of its days with a Good Air Quality Index score. The EPC operates 30 air monitors and 12 special purpose monitors that report Carbon Monoxide, Lead, Nitrogen Oxide, Ozone and Particulate Matter levels. The average 2020 readings for ozone, nitrogen dioxide, sulfur dioxide, and particulate matter (PM) 2.5 all rated “good” on the Air Quality Index (AQI) scale. The average readings for PM10 rated “moderate” on the AQI scale. The highest 1-hour average recorded for PM10 was 61.1 in early July, which is rated “unhealthy” on the AQI scale and was likely due to fireworks, of which PM10 is a notable pollutant.
Data reported in 2019 by the Florida Department of Health show that 8.9% of the adults in Hillsborough County have asthma, which is higher than the state average of 7.4%. The percentage of adults with diabetes is 10.9%, which is less than the state average of 11.7% for the same time period.
The 2021 Hillsborough County Health Rankings reports that 26% of adults in Hillsborough County are obese, which is marginally less than the state average of 27%. In 2019, however, the Florida Department of Health reported that 30% of adults in the county are obese. Taken together, it is likely that between one-quarter to one-third of adults live with this condition. Despite this status, Hillsborough County is reported to have a generally low percentage of adults with cardiovascular diseases. According to the Florida Health Heart Diseases Reports, as of 2019, only 4% of the people in the county have angina or coronary heart disease and 3.5% of adults have had a heart attack. The overall Heart Disease Death Rate is also low in Hillsborough County in comparison with some of the peer counties across Florida.
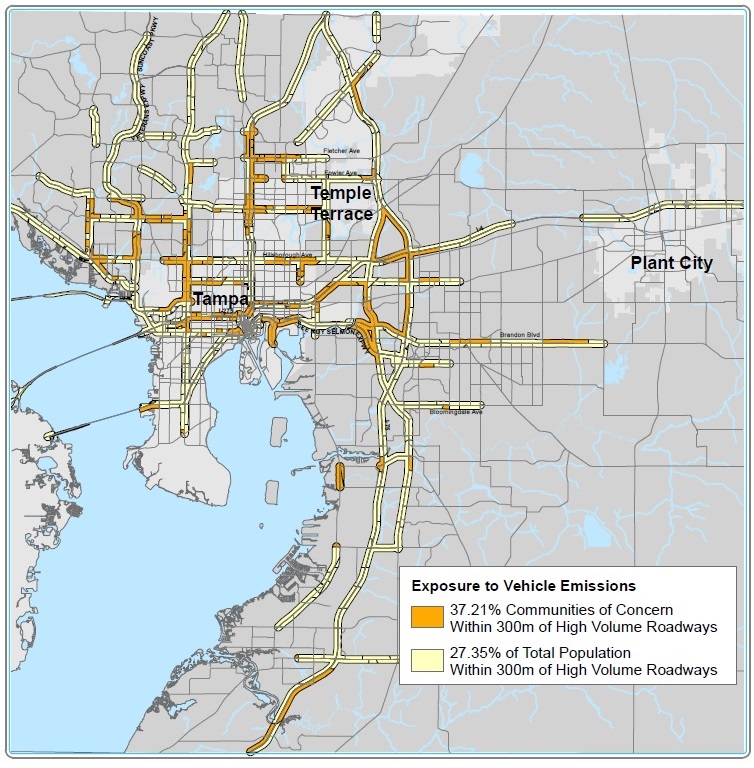
In Hillsborough County, more than one-quarter of the population lives in close proximity (within 300m) to a high-volume roadway that has greater than 30,000 vehicles per day. Those living in a Community of Concern are even more likely to live near these roads and as a result be exposed to vehicular air pollution. Between 2018 and 2021, there were 10 fewer miles of high-volume roadways across Hillsborough County. Despite the VMT reduction, decreasing in the past few years, the percentage of the total population living within 300m has increased by nearly 7% and the percentage of the Communities of Concern population increased by 14%. More research is needed to fully understand the causes behind this significant increase.
Recently there has been a shift towards electric vehicles in the county. Increased use of electric vehicles is a promising development which may help to reduce vehicular air emissions. Despite alternative fuels gaining in popularity, increases in VMT and traffic congestion may threaten to offset emissions savings that could be gained from electric vehicles. The Florida Department of Motor Vehicles reported that Hillsborough County had almost 7000 Electric Vehicle registrations in the second quarter of 2021 and is anticipated to increase in the coming years.
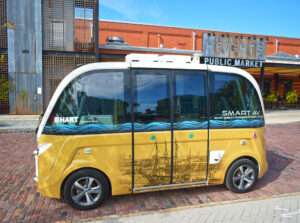
HART recently launched a pilot program for the HART Smart AV Shuttle, which is a fully autonomous vehicle that serves three stops Armature Works, Water Works Park and Straz Center in partnership with the Florida Department of Transportation (FDOT), operated by Beep Inc. This is a positive step towards Smart Mobility by providing innovative transportation solutions.
Spending on Smart Cities
Investing in Smart Cities projects can effectively relieve congestion and improve delays to help traffic flow. The 2045 LRTP identified that Hillsborough County can reduce delay at major intersections by almost 44% with additional revenue generated from the equivalent of a 1-cent sales tax, thereby improving travel time reliability by 20%. Investments in intersection improvements, advanced traffic management system (ATMS) projects, traffic monitoring CCTV, advanced vehicle detection, real-time signal timing adjustments, ramp metering and speed harmonization can dramatically improve systemwide performance.
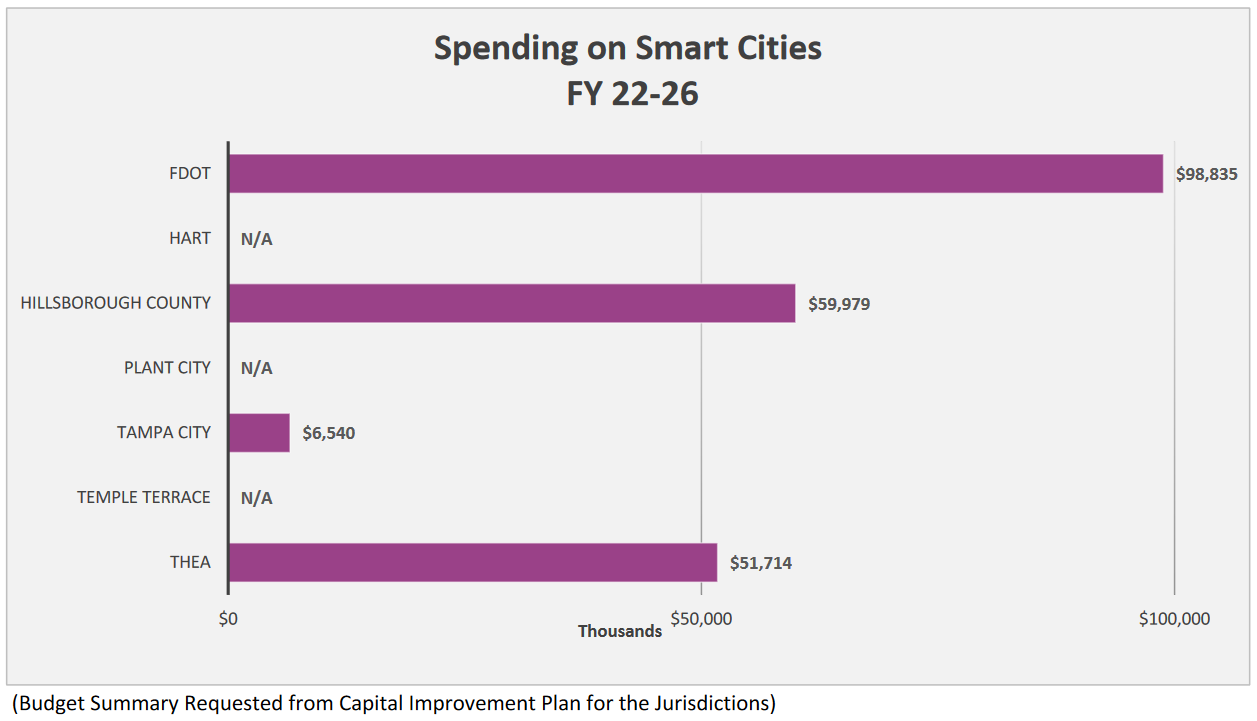
The various jurisdictions within Hillsborough County have programmed $217 million, or $43 million per year, to fund various Smart Cities projects for the five-year period from 2022-2026. This amount represents a 15% reduction in funding when compared to the five-year period from 2015-2019. If this trend in existing funding continues, we will fall short of achieving the TPO’s forecast for 2045 of reducing delay on major roads by 40%. Hillsborough County estimates the shortfall in funding for its intersection improvement program at $296 million over the next five years; $415 million is needed and $119 million is available.
Real Choices When Not Driving
According to the Census Bureau, about 2.3% of the population lives in a zero-vehicle household. The TPO’s Transportation Disadvantaged Service Plan estimates about 2.8% or 43 thousand residents of Hillsborough County are disabled or have no access to a vehicle, putting them in a critical need category. By contrast, 31% of the county’s residents have the potential to be transportation disadvantaged due to age, income, or disability, and may need to county on transit, walking, bicycling or other modes in order to access daily needs.
Transit Service
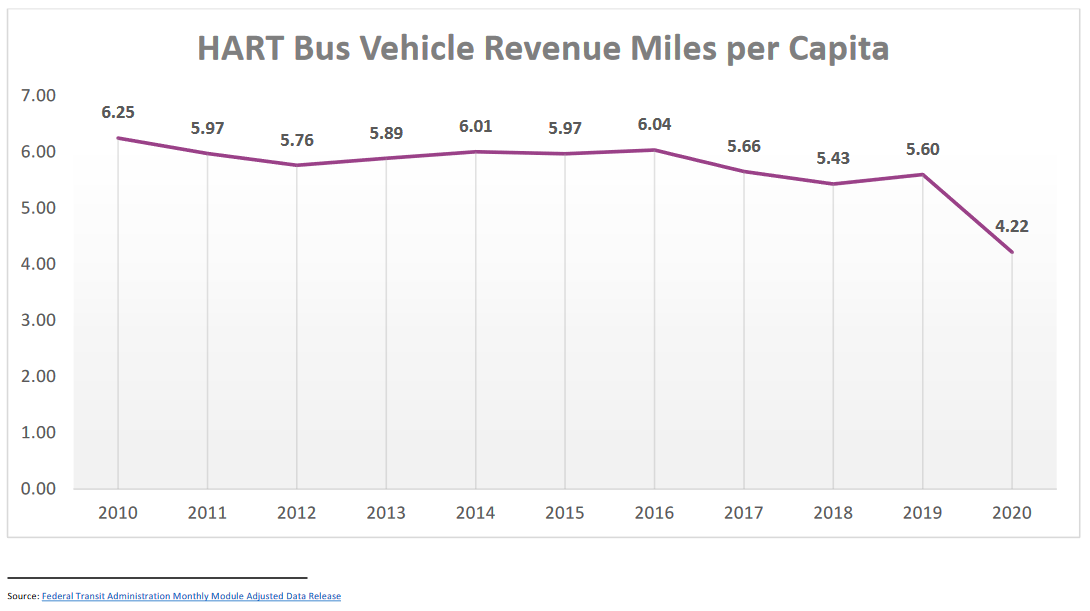
Transit Service Availability is an important factor to measure the amount of transit service available on our roads. Over the past three years, Vehicle Revenue Miles (VRM) dropped by more 60% compared to the pre-pandemic average, likely due to Mission Max, in which HART reduced service on several routes in an effort to provide more efficiencies and live within its budget. Looking at the amount of vehicle revenue miles provided per capita is a way to compare HART’s service levels with transit systems in other cities. HART’s VRM/ capita dropped by 25% in 2021 compared to 2020, as HART scaled back service during the pandemic.
People and Jobs Served – Using the current service routes for HART, it was found that about 10% of the population and jobs in Hillsborough County are served with transit routes with 30-minute frequency or better, while about 19% of the people and 39% of the jobs are served by a transit route with a 60-minute service or better. The chart representing the jobs and people served by HART transit service can be found here.
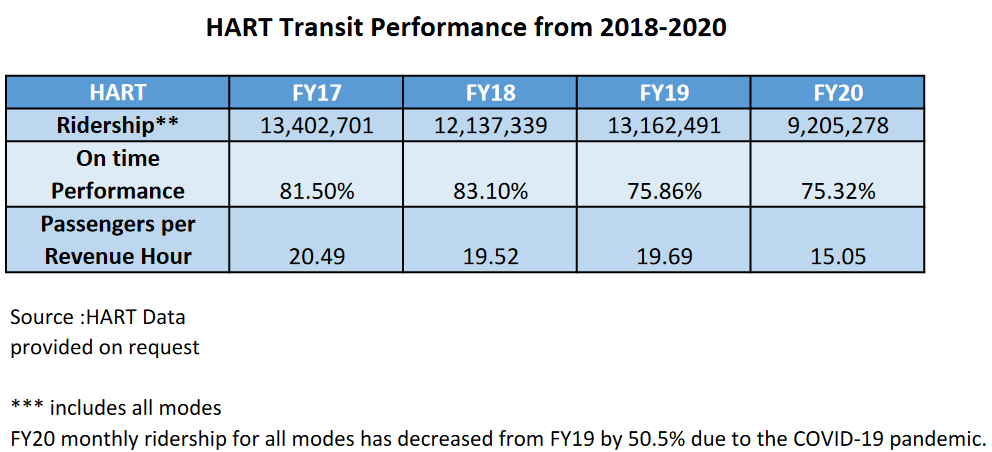
Ridership – HART currently serves more than 800,000 people and has an estimated ridership of 9.2 million as of 2020. HART ridership declined following a 2017 service area contraction and was greatly impacted again in 2020 due to the COVID-19 pandemic. Data from July 2021 show a decrease in ridership of about 28% (5,302,633 trips) for all fixed route modes compared to the previous year.
Transit Trip Length – Average Transit Trip Length in 2020 is 4.73 miles as reported by the National Transit Database (NTD).
On Time Performance – HART has an average on-time performance rate of over 75% as reported in 2020. The average monthly on-time performance for the streetcar in 2020 was 99.79%, according to HART.
Passengers per Revenue Hour – is a measure used to quantify service usage and the number of passengers on each bus. This is calculated based on the total number of riders, divided by total number of hours the service is in operation and available to passengers. This measure is also helpful in looking at the different routes and comparing them. On average, Passengers per Revenue Hour dropped by nearly 39% from July 2020 to July 2021 according to HART’s Budget Report presented to their Board in September 2021, again in relation to the pandemic. The best performing routes were Route 34-Hillsborough Ave, Route 1–Florida Ave and Route 400-Nebraska/Fletcher MetroRapid, which all had approximately 16 passengers per revenue hour. The streetcar line had a higher passenger per revenue hour rate with a monthly average of 23.8 in 2020 despite a 43% drop between January and December.
Non-Motorized Travel
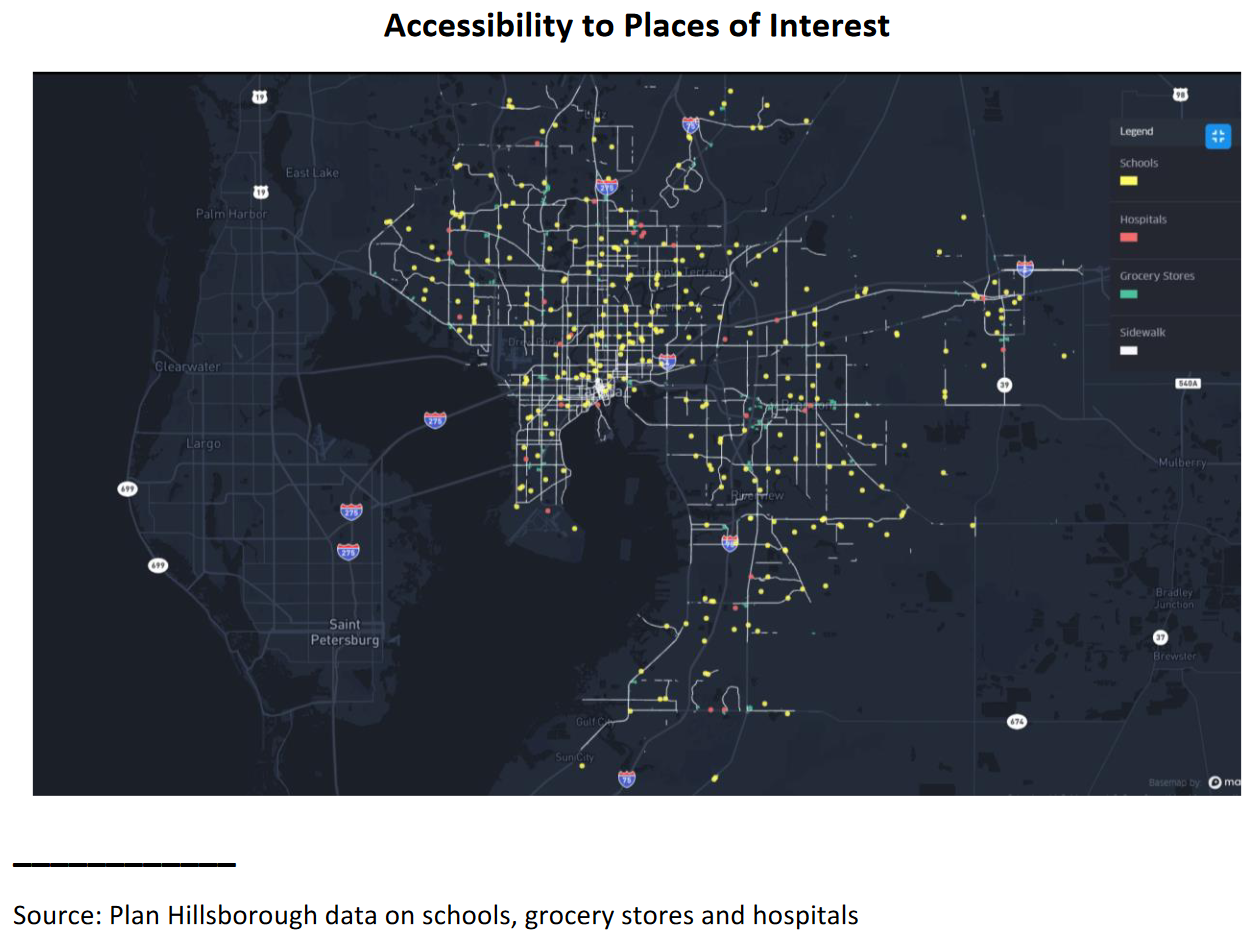
Non-motorized travel includes walking, biking and micro-mobility modes including electric scooters, carts, and bikes that operate at low speeds. Hillsborough County has over 554 miles of bike lanes, 1,225 miles of sidewalks, and 925 miles of paved trails and shared-use paths. Access to basic needs like food, education and healthcare is a challenge to these residents. This map shows the places of interest that are accessible via a sidewalk.
Level of Traffic Stress
The TPO established a new standard to assess the bike and walk facilities in the county. Level of Traffic Stress (LTS) is a way of accounting for the stress experienced by vulnerable road users. It is estimated based on the number of lanes, signal timing, posted speed limit, average daily traffic and existing walking and biking facilities on roadways. Roadways with LTS 1 offer less stress and comfortable to all road users, while LTS 4 indicates that the facility is uncomfortable for bicyclists and pedestrians. The Bike and Pedestrian LTS is an indicator for evaluating the streets which are safe and comfortable for bicyclists and pedestrians. It helps to recognize the improvements to the existing facilities to make it safe and comfortable for users and prioritize dollars accordingly.
In Hillsborough County 56% of roads are LTS 4 or worse for walking, and 70% are LTS 4 or worse for cycling.
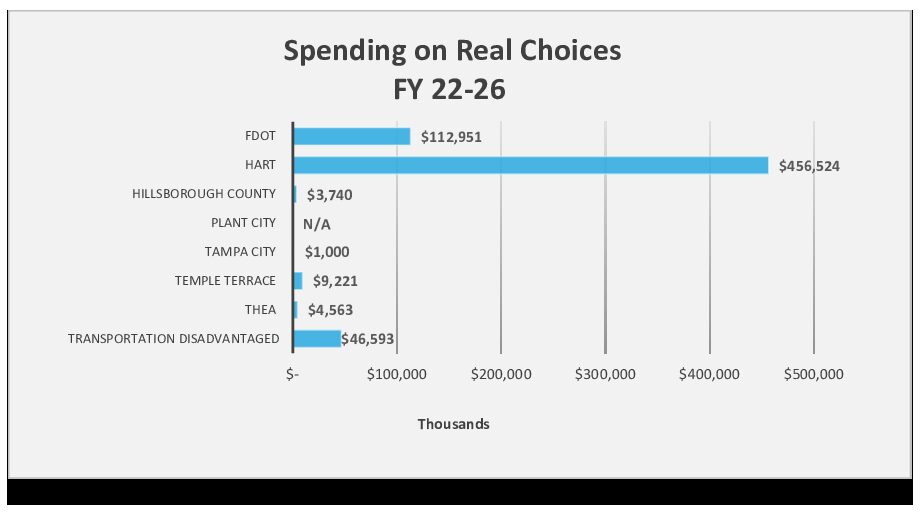
Spending on Real Choices When Not Driving
Investments in multimodal options will help build a connected network of trails, multi-use paths, transit, and paratransit services for the transportation disadvantaged. $635 million will be invested by all the jurisdictions on approximately 80% of the roads, build over 150 miles of trails, and improve transit and paratransit services.
Performance Based Planning and Programming
Transportation performance measurement is one step in a continuous cycle toward addressing the community’s needs. The cycle includes evaluating current conditions, setting goals and targets to improve conditions, prioritizing investments to make progress towards goals, and then evaluating conditions again as improvements are made. The 2045 Long Range Transportation Plan (LRTP) outlines our community’s long-term goals, and it groups projects into five categories based on their benefit to performance measures. These categories are as follows: State of Good Repair and Resiliency, Vision Zero, Smart Cities, Real Choices When Not Driving, and Major Projects for Economic Growth. The Transportation Improvement Program (TIP) reports annually on investments in each of those categories and sets priorities for each coming year’s round of investments. The State of the System Report is the third leg of the stool, tracking our community’s progress in each of these five categories over time.
This cycle is referred to as Performance-Based Planning and Programming. Federal law requires that metropolitan planning organizations like ours in areas of 200,000+ population establish targets for performance measures to ensure that the states, transit agencies and the TPOs carry out transportation planning and focus on investments to prioritize the projects to achieve the targets. The TPO establishes policies and plans and support decisions to fund the longer-term visions through the LRTP as well as through the specific projects in TIP that helps to achieve the near-term goals as a result of the performance-based planning process.
One of the main objectives of the performance-based planning process is to report the current state of the transportation system and compare it with the target. This is achieved through the State of the System report. The 2021 State of the System report is a representation of how the Hillsborough County has been performing in the last three years. In the upcoming reports, which will be updated frequently, there will be a focus on the measures that require immediate attention as part of the TPO’s plan to maintain the goals and vision of the county. This helps to keep the regional planning partners involved in our plans and allows decision-makers to make informed decisions and channel the investments towards projects that have been identified in our transportation plan.
