The Planning Commission produces demographic and economic data in raw form for use within the agency’s various projection models. If requested, the Planning Commission provides demographic and economic analysis, to individuals and organizations in Hillsborough County. This support ranges from the provision of data, to survey implementation, to trend analysis. For additional information about the building permit program, contact economist Yassert Gonzalez at 813-582-7356.
Please browse some of the most requested data items:
Demographic and Economic Profiles
Equity & Inclusion
Concentrations of Poverty: 1970-2018
Demographic and Economic Profiles
The Planning Commission routinely generates demographic and economic profiles for all and sundry geographic boundaries (e.g., cities, unincorporated areas, ZIP Codes) within Hillsborough County. These comprehensive profiles include estimates and projections for dozens of data elements (e.g., housing units, population, employment, building permits, race/ethnicity, educational levels). Click on the links below for details:
Alternatively, the Planning Commission has prepared dashboards for users to access new building and demolition permits:
1. New Nonresidential Building Permits Issued (2018-2022)
2. New Demolition Permits Issued (2018-2022)
3. New Residential Building Permits Issued (2018-2022)
If studying development trends, in addition to permits issued, it would be prudent to look at newly built parcels as well:
1. Newly Built Nonresidential Parcels (2018-2022)
2. Newly Built Residential Parcels (2018-2022)
Equity & Inclusion
The Planning Commission recently concluded its Nondiscrimination and Equity Plan. For more information, please email or call Joshua Barber at BarberJ@plancom.org or call (813) 576-2313.

Click to navigate to the Nondiscrimination and Equity Plan page.
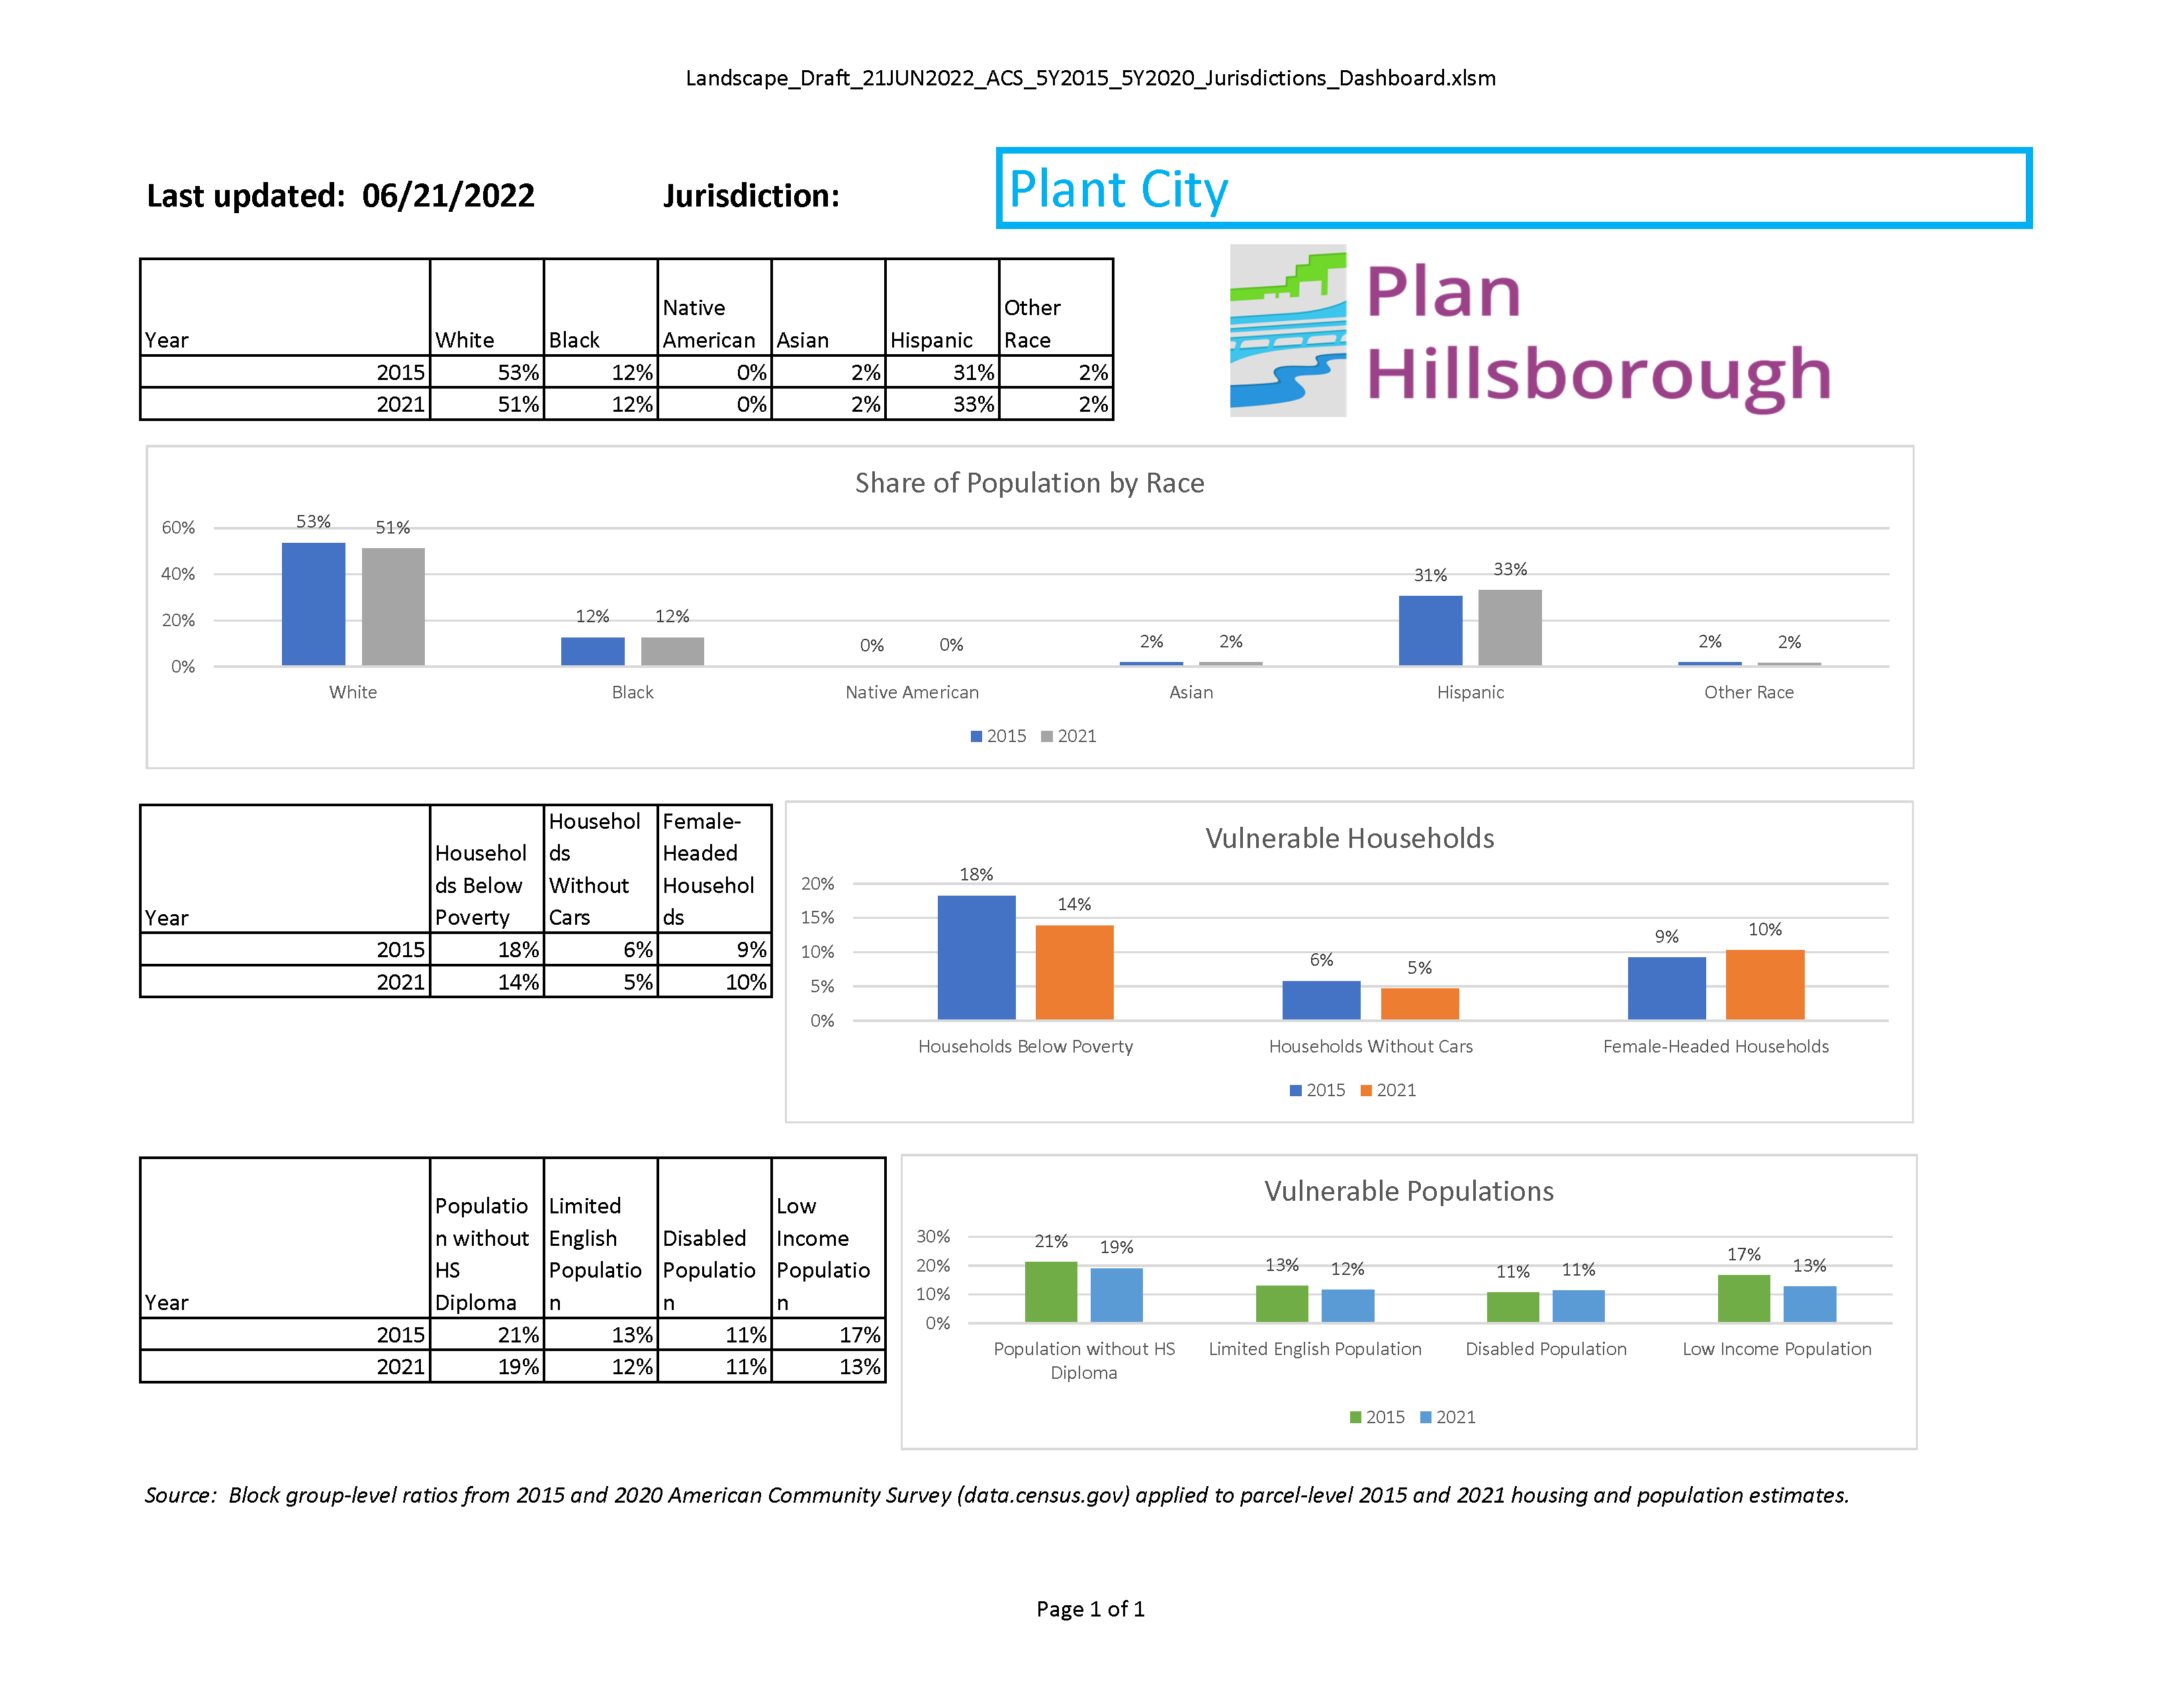
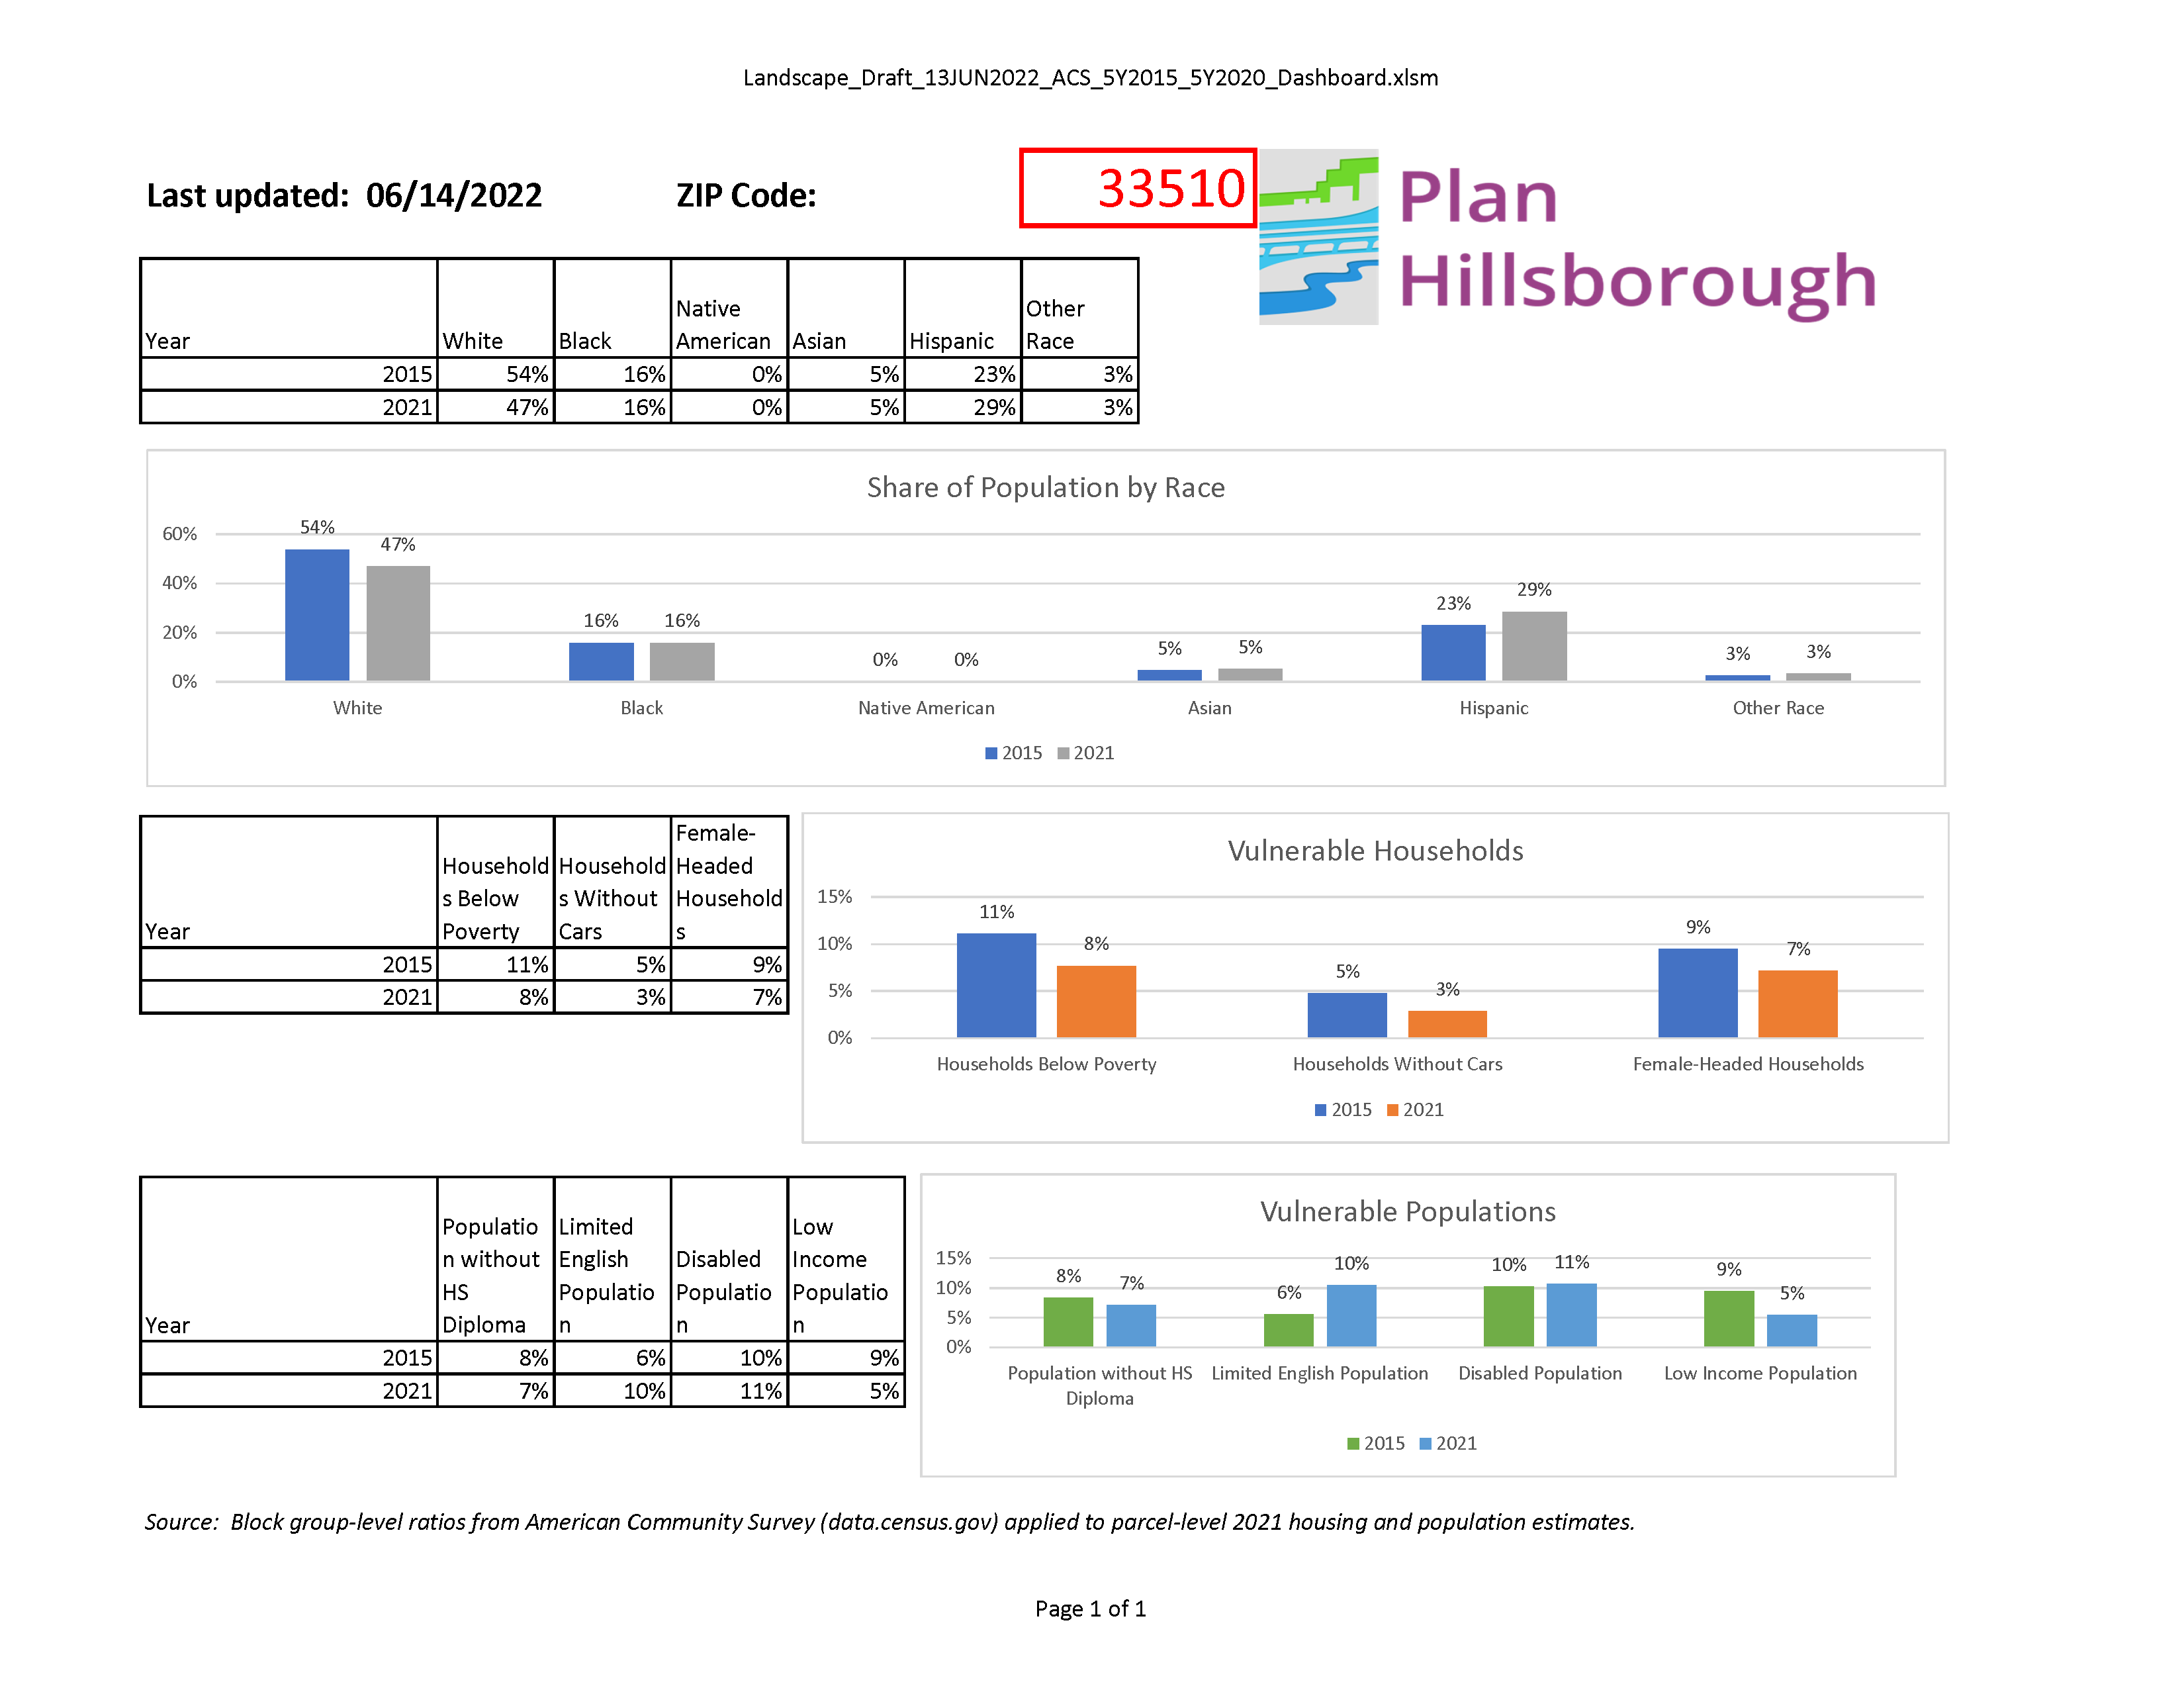
As part of the plan implementation efforts, we are currently tracking equity and inclusion metrics by various geographies. Web Scenes are interactive maps that help user to visualize the location of vulnerable populations in Hillsborough County. For instance, a user could view where in Hillsborough County they could find the largest concentrations of limited English Speakers or the percent of households without vehicles in a specific area.
We also have created dashboards where we would be tracking changes across time. For example, a user can find out whether the population of Limited English Speakers in Plant City is higher than 2015 or, for ZIP Code 33510, whether the percent households without cars is lower than in 2015.
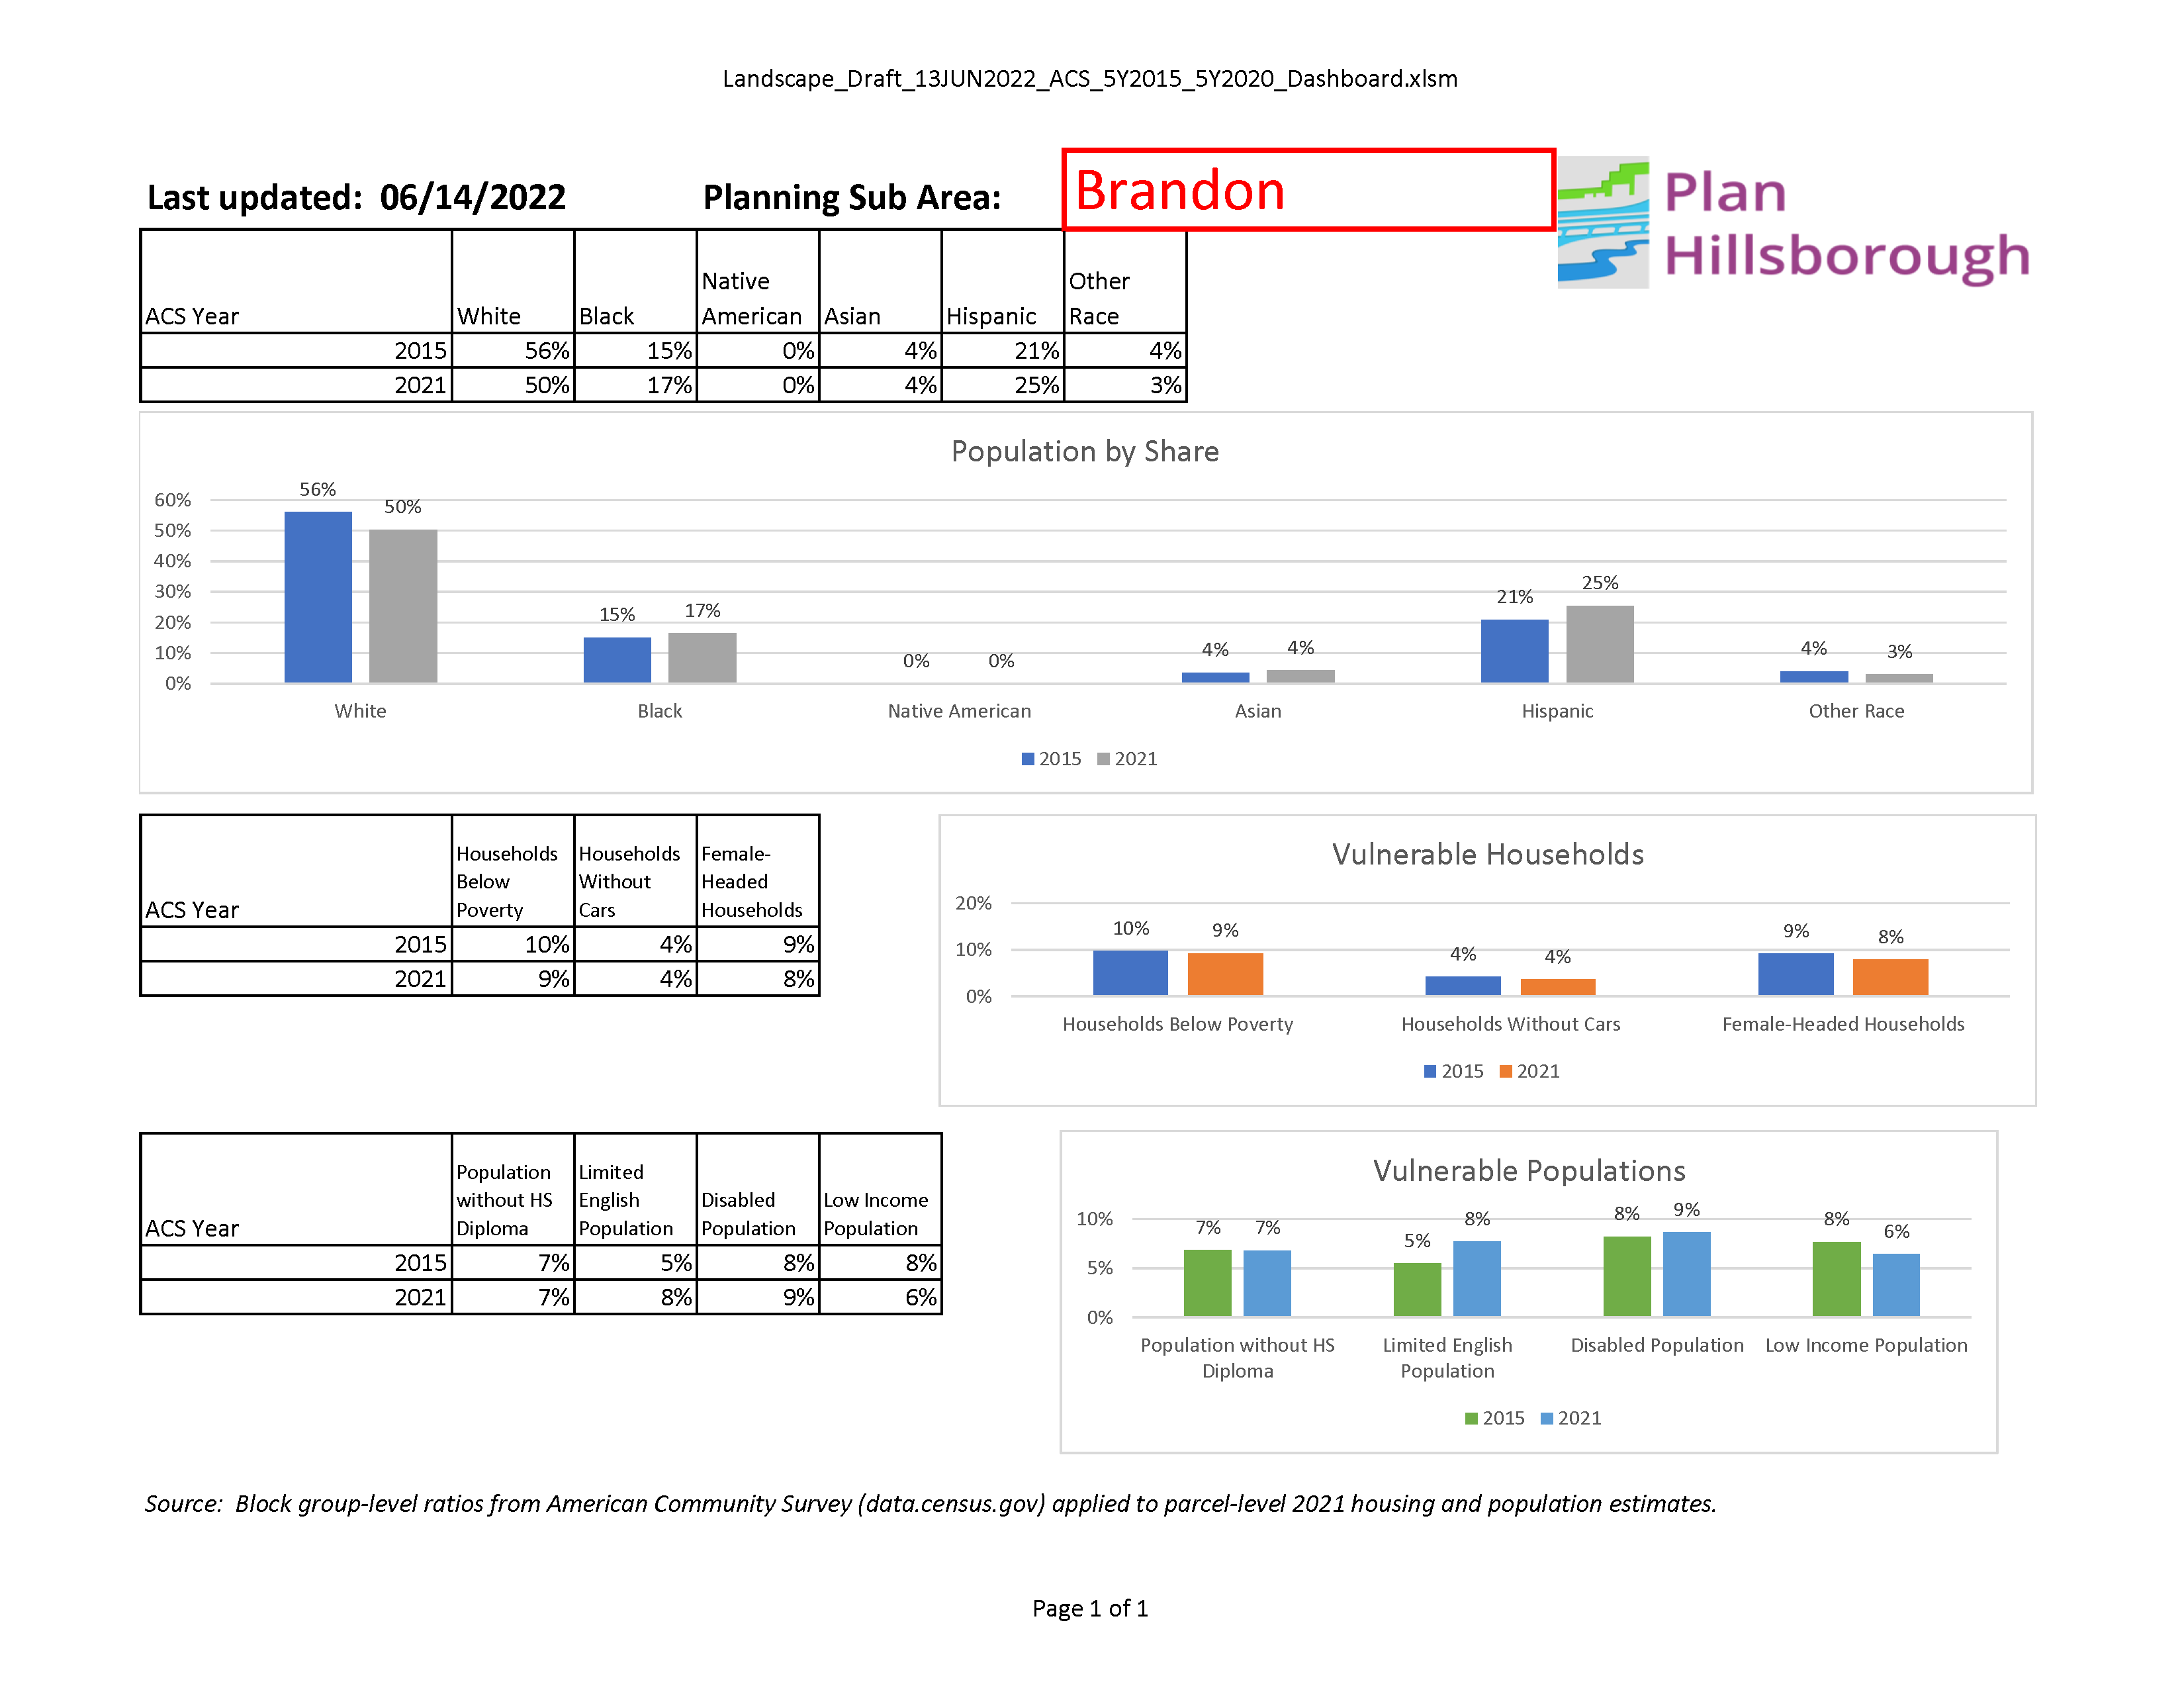
3) Planning Sub Area Dashboard
Concentrations of Poverty: 1970-2018
The Concentrations of Poverty: 1970-2018 provides an overview of poverty in Hillsborough County both with respect to how poverty thresholds are defined and where the impoverished live in the county. The report incorporates nearly 50 years of Census data to trace spatial changes over time. The Concentrations of Poverty report is available as a download or as an interactive story-map.