August 2020 – The State of Florida’s Demographic Estimating Conference recently announced that, due to the pandemic, Florida’s Population for 2025 will be 200,139 fewer people than originally projected in December of 2019. This announcement raises the thorny issue of population projections in the era of COVID-19. How can we prepare population projections in a pandemic? Although this question seems relevant to COVID-19, it is not the first time demographers have had to prepare projections amid an uncertain time. In fact, rarely has there been an opportune time to prepare a demographic forecast as there is no safe vantage point. Inevitably, there are occurrences that can thwart a population trend analysis. However, there are numerous sources that can be used to construct reasonable forecasts that time and time again have proven to correspond with the “true” numbers enumerated each decennial Census.
The Bureau of Economic and Business Research (BEBR) prepares population projections annually with a 25-year horizon. Comparing their historical published projections against the actual reported Census numbers provides some insight into their accuracy. The chart below compares three series of projections circa the recession that occurred late 2007 through late 2009. We picked this time period to reveal how the projections may be adjusted over time due to circumstances.
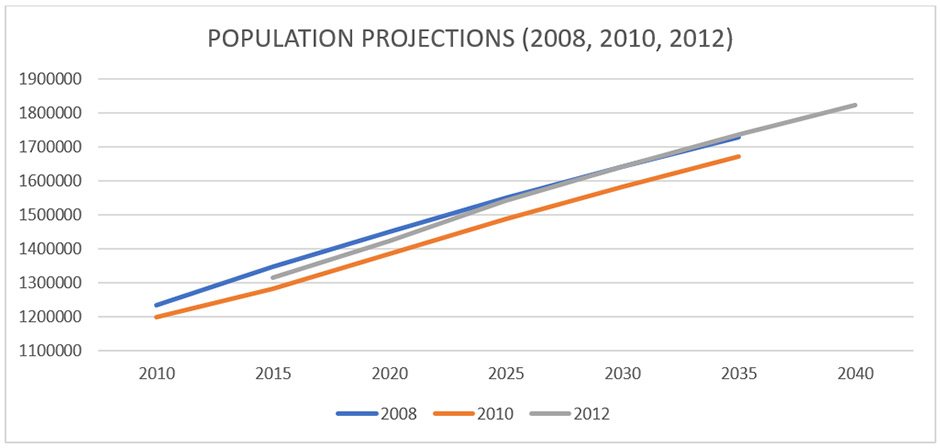
As demonstrated in the above chart, the projections for the year 2010 straddle the reported 2010 Census value of 1,229,247. The difference between the two projections is small, approximately 35,500 people separate the two projections (obviously, the projection dating from 2012 provides no information for 2010).
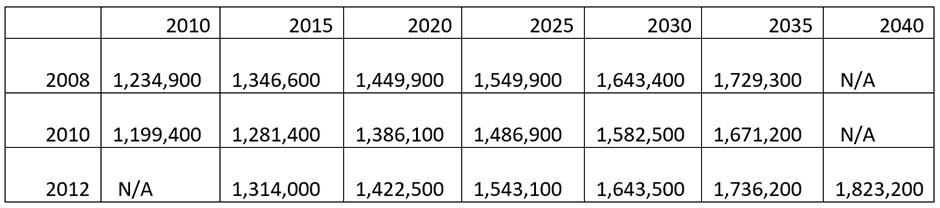
However, with the projections released in 2012, the numbers begin to coalesce around the year 2025 for projections issued in 2008 and in 2012. The table above includes the data published by BEBR.
Since BEBR’s estimates rely on both housing data as well as utility connection data (the ratio of households receiving electricity), the model remains robust and sensitive to changes in population. This sensitivity allows projections to be adjusted based on changes in business cycles as well as other circumstances such as pandemics.
This brief example simply serves to demonstrate the flexibility most population projection methodologies incorporate. Major events such as pandemics or abrupt changes in the business cycle create measurable impacts in projection systems. These impacts could be the decline in new home construction, a decrease in electricity consumption or increases in vacancy rates. All these effects are measurable and will be incorporated in the model to reflect a declining population projection.
Author: Planning Commission Reference and Data Team
![]()