March 2021 – The Planning Commission maintains a database of historical permit activity from the year 2000 to the present day. Having completed our analysis of quarter four for 2020, staff has taken the opportunity to review and reflect on some historical trends over the twenty-year time frame. Generally, permit activity is currently at the same level as it was in the years 2000 or 2001. From 2003 to 2006, Hillsborough County saw a record number of permits being issued with a peak of 17,444 permits issued in 2005 before the recession.
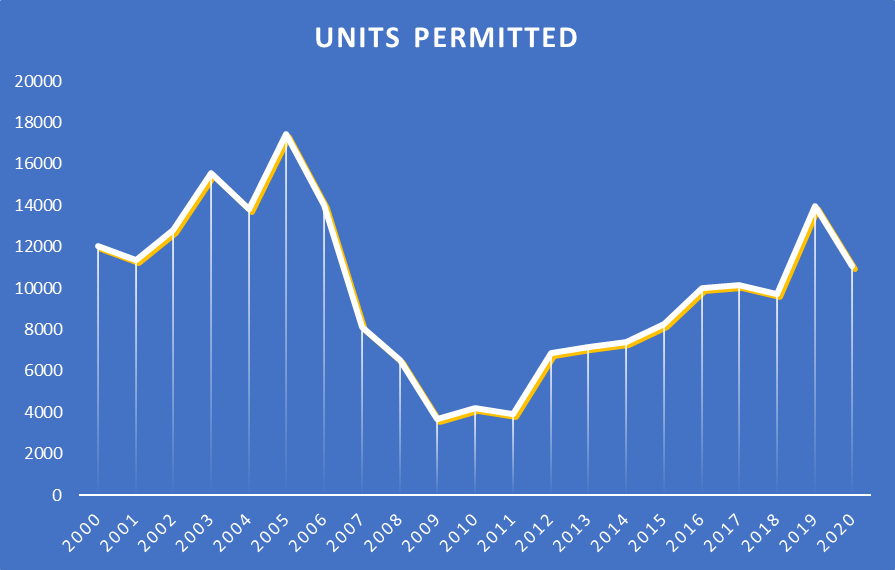
The recession had a significant impact on new construction and residential permits being issued. From a peak of 17,444 permits in 2005, permit activity fell to a record low of 3,686 permits in 2009. It would take until 2012 until permit activity began to resemble a normal pattern. From 2012 onwards, permit activity improved year-over-year in number of permits issued. Permit activity had a recent, post-recession peak in 2019 of 13,978 permits issued before the pandemic and another recession. The residential permit activity for 2020 was 11,061 units permitted.
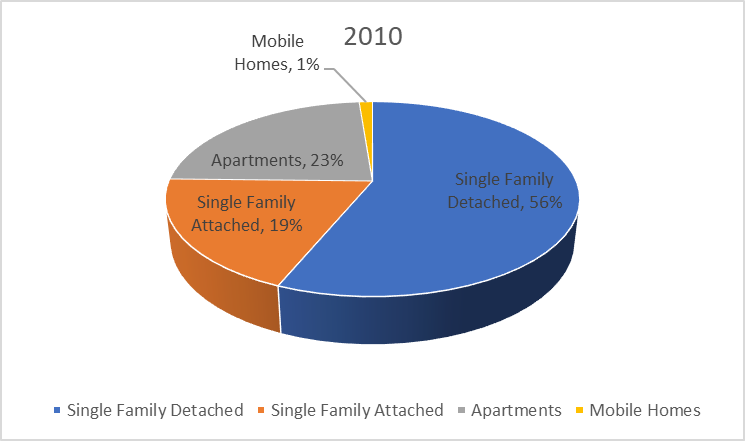
In terms of types of permits being issued, Single-Family Detached, Single-Family Attached, Apartments and Mobile Homes, the percentages have changed over time in response to changing market demand. In 2010, Single-Family Detached permits accounted for 56% of permits issued. Apartments accounted for 23% of permits issued and Single Family Attached accounted for 19% of permits issued.
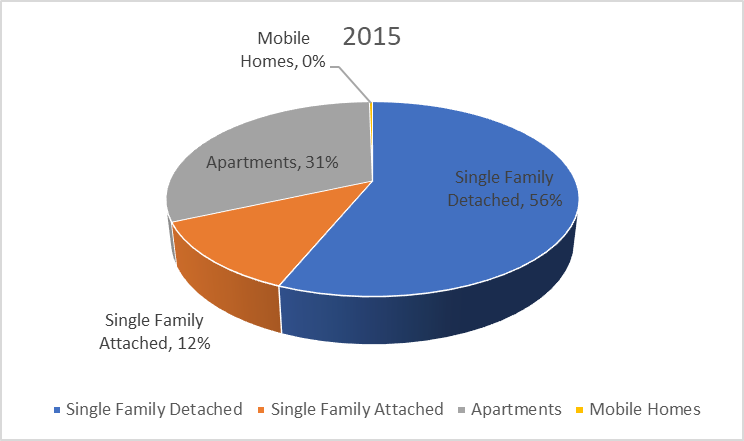
By 2015, Single Family Detached permits still accounted for 56% of permits issued but Apartments had increased to 31% of total permits issued. Single Family Detached Units had decreased to 12% of total units issued.
In 2020, Single Family Detached permits accounted for 64% of total permits issued. Apartments have decreased to 23% as a share of permits issued and Single Family Attached account for 13% of total units permitted.
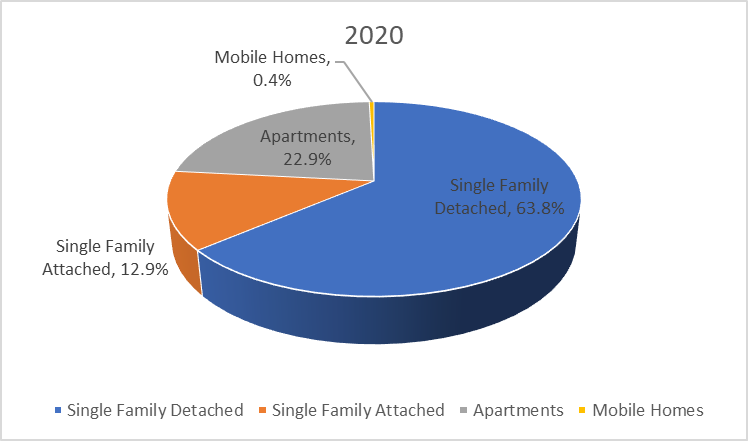
In the 20 years of permit activity, the total share of permits issued represent 54.9% for Single Family Detached, 18.1% for Single Family Attached, 25.7% for Apartments and 1.3% for Mobile Homes.
![]()