July 2022 – Changes in housing prices are a perennial topic of discussion in Florida[i]. Lately, there has also been a preoccupation with inflation locally and nationally[ii]. Typically, when discussed in the press, changes in housing prices are for large regions (e.g., Tampa Bay, Tampa–St. Petersburg–Clearwater Metropolitan Statistical Area (MSA), Hillsborough County) and calculated using nominal prices. In the hopes of making changes in these prices more relatable to our readers, this article discusses changes in the price per square foot for single-family homes by ZIP Code.
As the recent spike in inflation has made us painfully aware, the value of money changes over time. A dollar in 2010 bought more real estate than a dollar does today. We also know there may be a lot of variation in houses across the city (or even in the same block!). Thus, we use price per square foot to make fairer comparisons across houses and geographies. Here, we analyzed inflation-adjusted price per square foot for single family homes from 2010 through 2021.[iii] [iv]
As seen in Figure 1, below, for ZIP Code 33602 (Downtown Tampa), the inflation-adjusted median price per square foot decreased from $106.72 in 2010 to $76.34 in 2012 (28% lower). This was likely due to the lingering effects of the Great Recession[v]. Currently, the inflation-adjusted price per square foot is $193.19 (253% or nearly three times higher than 2012). As suggested by Table 1 and Figure 2, constant prices followed a similar pattern in areas across the county.
In most ZIP Codes, real price per square foot for single family homes has increased dramatically since 2015. Thus, for many families, homeownership is almost beyond reach. Hillsborough County and the Planning Commission are trying to assist these families in various ways. The Affordable Housing Services Department has programs aimed at low- and moderate-income residents. The Planning Commission is currently updating the Housing Section of the Unincorporated Hillsborough County Comprehensive Plan Update[vi] and retained a consultant to explore the Affordable Housing Density Bonus.
Figure 1. 2010-2021 Median Price per Square Foot in Constant 2012 Dollars
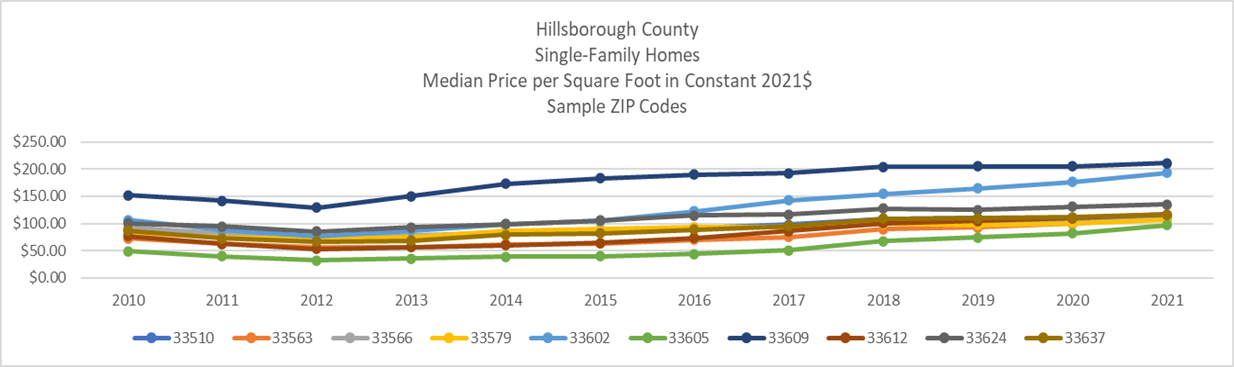
Table 1. Percent Change in Median Price per Square Foot for Single-Family Homes by ZIP Code
| Place | ZIP Code | Percent Change 2010-2015 | Percent Change 2015-2021 | Percent Change 2010-2021 | Annual Percent Change 2010-2015 | Annual Percent Change 2015-2021 | Annual Percent Change 2010-2021 |
| Brandon | 33510 | -1% | 33% | 31% | -0.26% | 5% | 3% |
| Plant City | 33563 | -13% | 72% | 49% | -3% | 12% | 4% |
| Plant City | 33566 | -6% | 27% | 19% | -1% | 4% | 2% |
| Riverview | 33579 | 10% | 18% | 29% | 2% | 3% | 3% |
| Downtown Tampa | 33602 | -2% | 84% | 81% | -0.33% | 14% | 7% |
| Ybor City/Palmetto Bay | 33605 | -19% | 144% | 98% | -4% | 24% | 9% |
| Westshore | 33609 | 20% | 15% | 39% | 4% | 3% | 4% |
| North Tampa/USF | 33612 | -16% | 81% | 52% | -3% | 14% | 5% |
| Carrollwood | 33624 | 5% | 27% | 34% | 1% | 5% | 3% |
| Temple Terrace | 33637 | -5% | 42% | 35% | -1% | 7% | 3% |
Figure 2. Growth rates by Period for Single-Family Homes in 10 Sample ZIP Codes
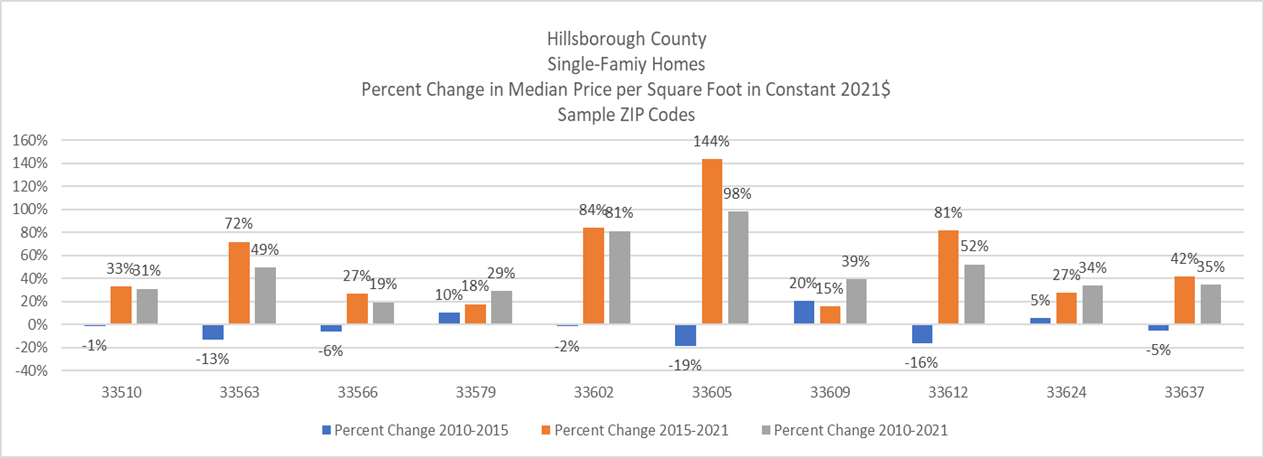
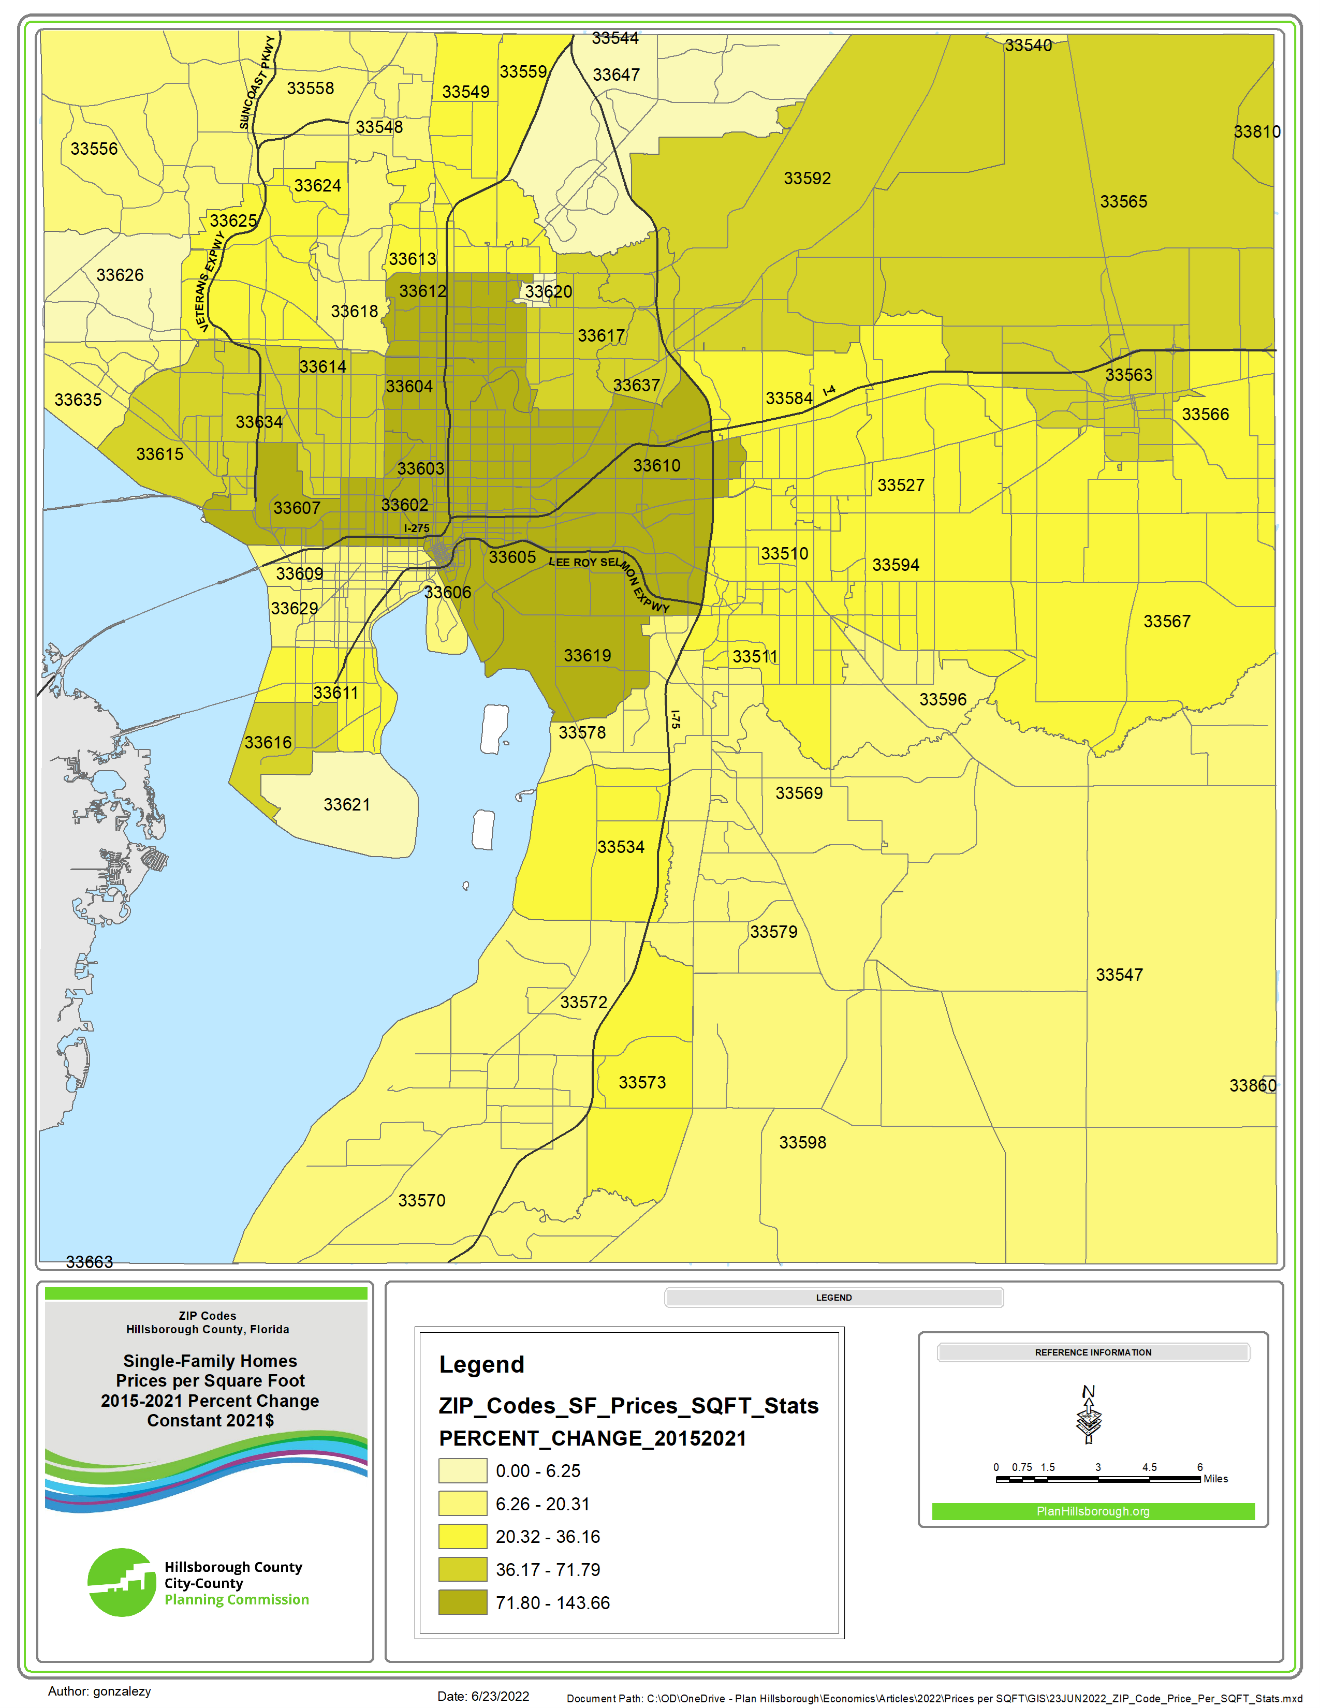
Figure 3. 2015-2021 Percent Change Median Price per Square Foot for Single Family Homes by ZIP Code (Click on map or here for online version)
![]()
[i] News Service of Florida. (2022, June 22). Tampa now leads the nation in housing price increases. Creative Loafing Tampa Bay. https://www.cltampa.com/news/tampa-now-leads-the-nation-in-housing-price-increases-13533130
[ii] Bhat, P., & Ghosh, I. (2022, June 22). Fed to lift rates by 75 basis points in July, 50 bps in September – Reuters poll. Reuters. https://www.reuters.com/markets/europe/fed-lift-rates-by-75-basis-points-july-50-bps-september-2022-06-22/
[iii] Prices for single-family homes in Hillsborough County came from Hillsborough County Property Appraiser. Prices prior to 2021 were inflation-adjusted using the Consumer Price Index – Housing for the Tampa–St. Petersburg–Clearwater Metropolitan Statistical Area (MSA)
[iv] A nominal price is converted to a constant price by multiplying a ratio of the CPI Housing. For example, a $1.00 in 2010 was worth $1.42 in 2021. Thus, a dollar in 2010 had 42% more purchasing power than a dollar in 2021. For more information about CPI Housing for Tampa Bay. https://www.bls.gov/cpi/data.htm
[v] Harwell, Drew. (2019, August 26). Remembering 2013, the year Tampa Bay’s housing market came alive. Tampa Bay Times. https://www.tampabay.com/news/business/realestate/remembering-2013-the-year-tampa-bays-housing-market-came-to-life/2160052/
[vi] Housing Section of the Hillsborough County Comprehensive Plan update to explore revising Affordable Housing Density Bonus. Connections to Tomorrow. July 2021. https://archive.planhillsborough.org/housing-section-of-the-hillsborough-county-comprehensive-plan-update-to-explore-revising-affordable-housing-density-bonus/
________