May 2021 – “Living and working in Tampa-Hillsborough isn’t quite like being on vacation every day, but it comes pretty close. Yes, there are theme parks and beaches and warm breezes in January. But there is also a vibrant mix of Fortune 500 companies, sassy tech start-ups, world-class health care facilities and serious educational options. And, hey, if a pandemic couldn’t faze Tampa, nothing will.”[i] – Florida Trend.
From the 2021 Regional Competitive Report[ii], we learned that the Tampa Bay Region was the third fastest-growing region in the country, and Hillsborough County is one of the largest economies within this region. The Bureau of Economic Analysis recently released 2001 to 2019 GDP information for all counties in the US[iii]. The real GDP is the value of all goods and services produced in the County adjusted for inflation. We will be exploring and comparing these new GDP figures below.
In 2019, Hillsborough County remained the 4th largest county economy in Florida behind Miami-Dade, Broward, Orange Counties, and just ahead of Palm Beach County. As seen in Figure 1[iv] below, the County generated nearly $85 billion in economic activity. This represented nearly 9% of the state’s economy ($940 billion). From 2010 to 2019, both Hillsborough and Miami-Dade Counties expanded their economies by an impressive 29%. This expansion was slightly larger than Florida’s (26%).
Figure 1. Local Area Real GDP for Top Five Counties in Florida
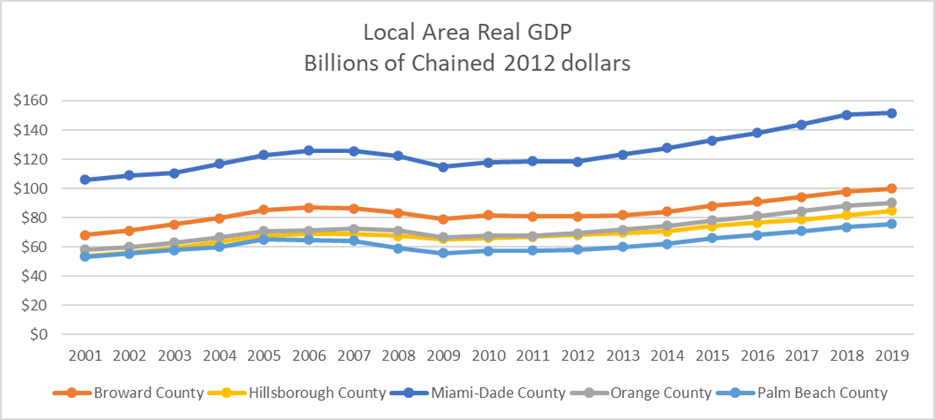
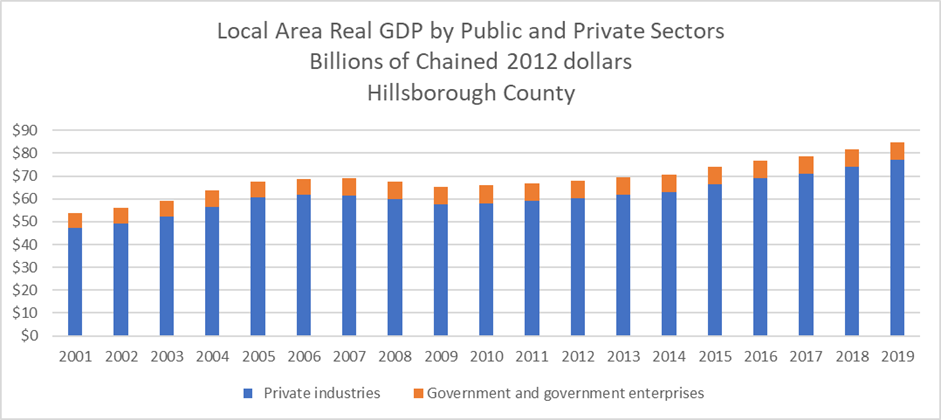
Figure 2 shows public and private sector contributions to Hillsborough County’s GDP. Private economic activity accounted for $77 billion. It grew 33% from 2010 to 2019 and represents 91% of the economic output (88% in 2001). As expected, this is the most dynamic sector of the county’s economy. The public sector generated $8 billion in economic output. After shrinking 1.6% from 2010–2015, it recovered and grew 3% from 2015–2019. It now represents 9% of the countywide economic output, down from 12% in 2001.
Figure 2. Local Area Real GDP by Private and Public Sectors
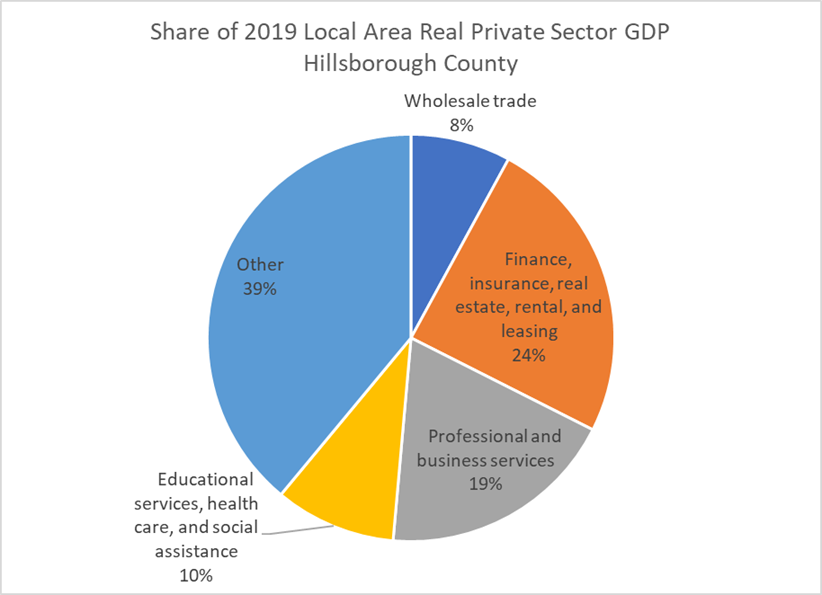
Within the private sector, the top five categories are Finance, Insurance, Real Estate, and Education (FIRE); professional services; and wholesale trade. Not surprisingly, given our reputation as a regional financial hub and magnet for new Florida residents, the largest category is FIRE. As seen in Figure 3, it comprises 24% of the 2019 real private sector GDP. From 2010, it grew 39% to $19 billion. Professional services are the second largest category. From 2010, this category grew 52% to $15 billion.
Figure 3. Share of 2019 Hillsborough County’s Private Sector GDP by Category
As we have seen, Hillsborough County’s economy expanded substantially in relation to 2010. Our economy is the 4th largest in Florida. Mercifully, the pandemic slump appears to be behind us. Our economy is recovering and expansion is expected to resume next year[v]. In the face of this significant increase in the county’s economic output, the next question is: What has happened to household income? In our next article, we will be looking at household median income and how it is distributed in the county.
![]()
[i] Ware, Janet. Spotlight: Tampa-Hillsborough. Florida Trend. November 2020, pp. 46-69. Link: https://tampabayedc.com/wp-content/uploads/2020/11/Fl-Trends_Tpa_Hillsborough_Portrait_Nov_20.pdf
[ii] State of the Region: 2021 Regional Competitive Report. Tampa Bay Partnership. Page 11. https://www.stateoftheregion.com/rcr.html
[iii] Unless otherwise specified, this article relies on figures from the Bureau of Economic Analysis’ Local Area Gross Domestic Product estimates. Link: https://www.bea.gov/data/gdp/gdp-county-metro-and-other-areas
[iv] Chained dollars are dollars adjusted for inflation. Chained dollars allow for comparison of dollar amounts over time. In this case, for comparison purposes, all real GDP figures were converted to 2012 dollars.
[v] Florida’s economy sees expanding growth. Connections to Tomorrow. Plan Hillsborough. March, 2021. https://archive.planhillsborough.org/floridas-economy-sees-expanding-growth/