March 2021 – “Be fast, have no regrets… If you need to be right before you move, you will never win”, Dr. Michael Ryan, Executive Director, WHO Health Emergencies Programme.
Undoubtedly, there have been a series of fortunate events. We now have various vaccines and mass vaccinations are underway in many countries. Mercifully, the flu season has been the one of the mildest on record.[i] As community immunity appears within reach, it’s time to check on Office of Economic and Demographic Research (EDR[ii])’s economic predictions. Back in July 2020, EDR expected economic expansion to begin this June. In fact, the state’s economy is already expanding! Moreover, it is expected to see growth in early 2022 (Q1 2022). Below, we are going to check on the latest forecasts for the three economic variables that we are following: Consumption, personal income, and unemployment[iii].
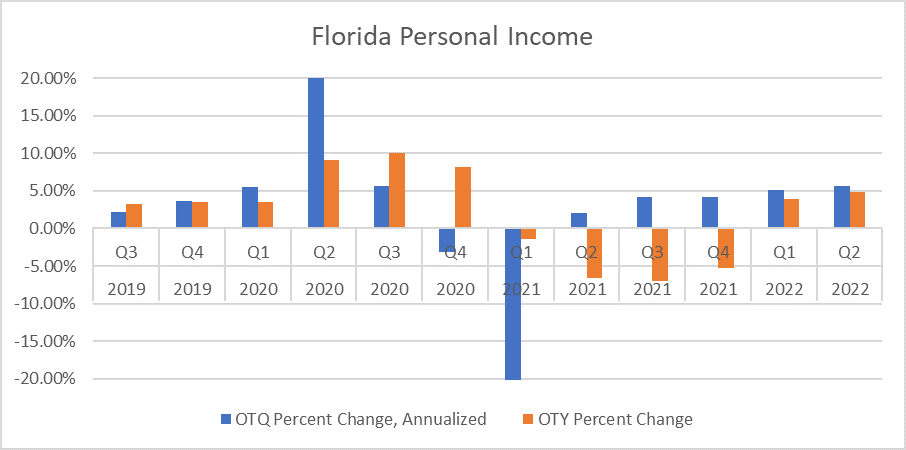
For each variable (i.e., consumption, personal income, and unemployment), EDR forecasts two values: Over-the-quarter (OTQ) and over-the-year (OTY). OTQ refers to changes over one quarter. For example, personal income increased 5.7% in July-September 2020 (Q3 2020). A negative number indicates contraction. A positive number indicates economic expansion or recovery. OTY refers to changes over a year for a specific quarter. For instance, personal income was 10% higher in September 2020 (Q3 2020) than in September 2019 (Q3 2019). A positive number indicates growth when compared to the same period in the previous year.
As seen in Figure 1, personal income has been recovering. As businesses continue opening or scaling up services, personal income is expected to continue expanding through September 2022. Overall growth over the previous year is expected to return by January 2022 (Q1 2022).
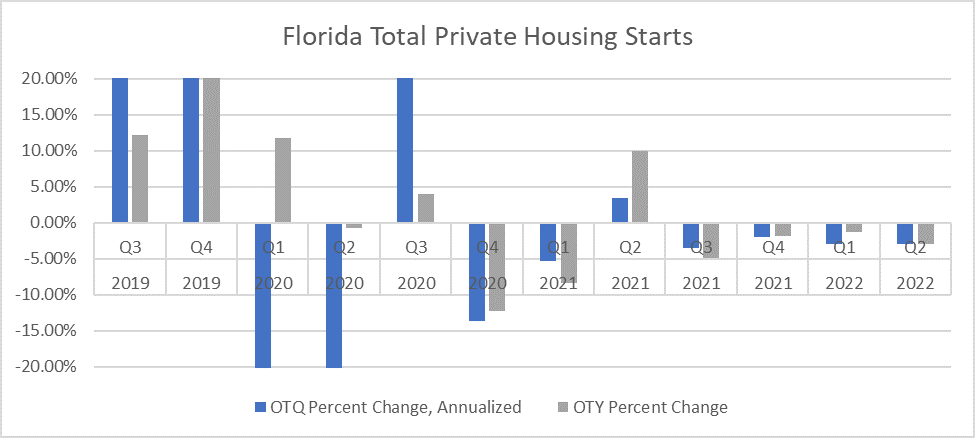
In terms of consumption, EDR does not forecast total consumption. However, it does forecast three consumption-driven activities: Housing starts, new light vehicle registrations, and total visitors. As seen in Figure 2, statewide housing starts have been volatile. Although growth is expected to be modest, housing starts should average 150,000 units per quarter through September 2022.
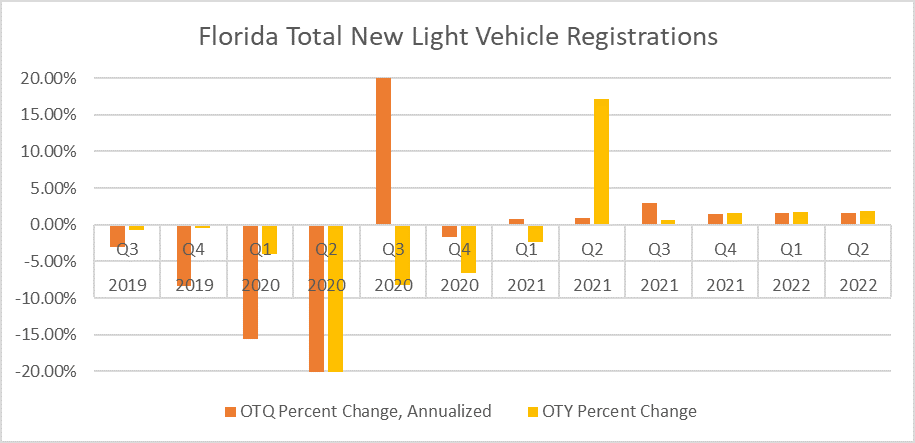
Total vehicle registrations is another proxy for consumption. As seen in Figure 3, vehicle registrations jumped 88% in the period July-September 2020 (Q3 2020). It is expected that they will surpass their 2019 levels by this April. From that point on, EDR expects nearly 300,000 new light vehicles registrations per quarter.
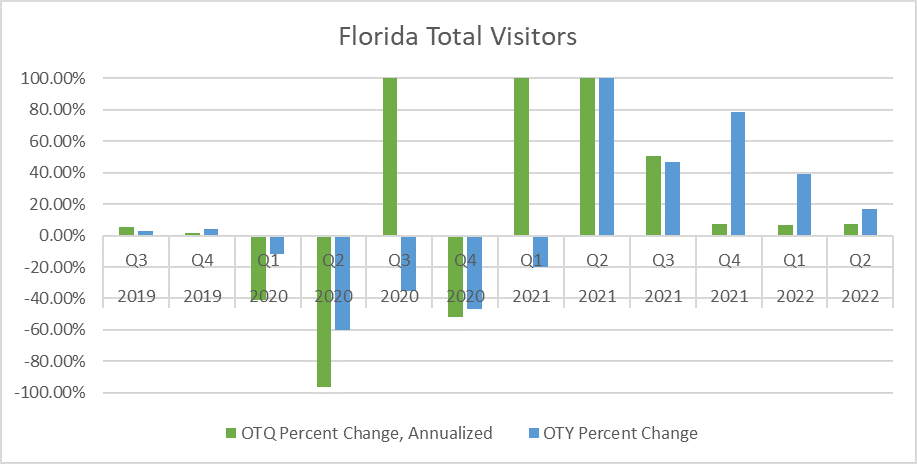
The last consumption proxy is total visitors. Quarterly visitor totals are expected to grow dramatically between 100% and 200% through June. Visitors will reach 33 million per quarter by September 2022.
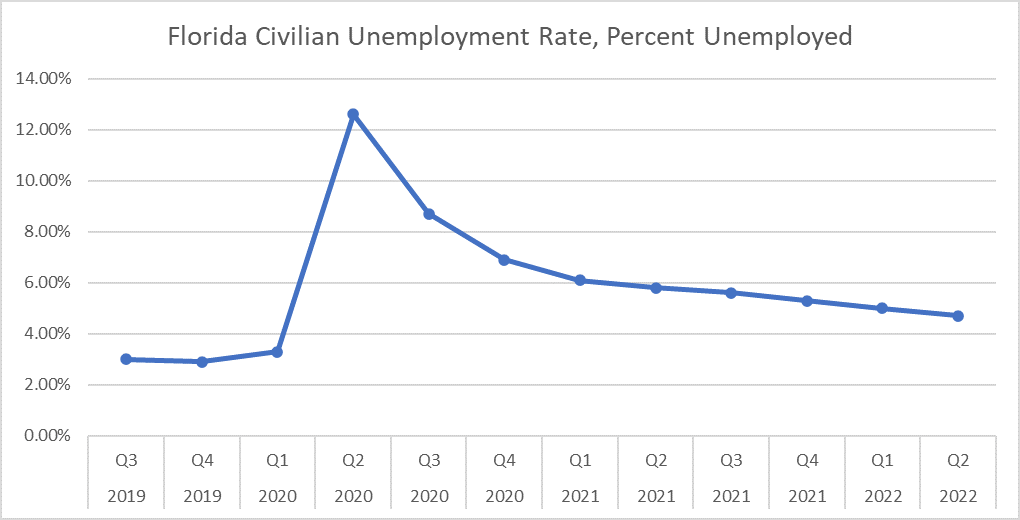
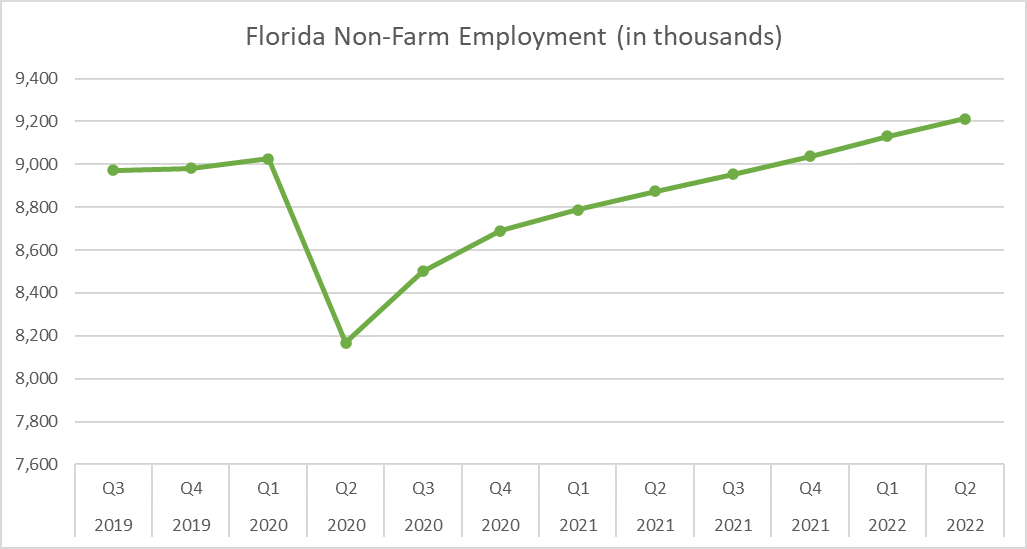
Unemployment is already declining. At this rate, we should have nearly full employment (4.7%) by September 2022 (Figure 5). At full employment, there are more jobs than folks seeking work. Anyone actively looking for a job finds one. Total employment is expected to exceed pre-pandemic levels by early next year (Figure 6).
Lastly, we look at the forecast for Florida’s entire economy. The state’s economy is already expanding. Over the year growth is expected to be around 2% through September 2022.
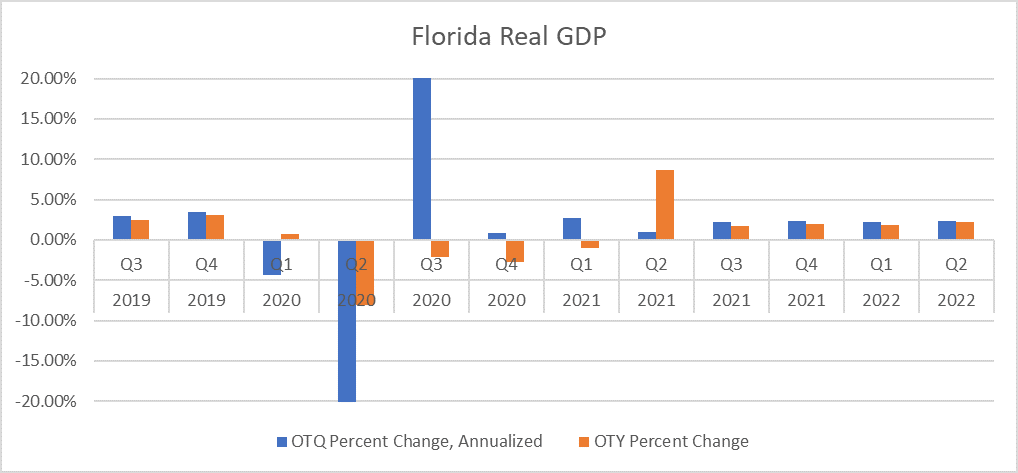
To conclude, the state’s economy is already expanding. Barring any economic shutdowns, the economy should resume normal growth through September 2022.
[i]Wu, Katherine. The Pandemic Broke the Flu. The Atlantic. February 4, 2021. https://www.theatlantic.com/science/archive/2021/02/covid-19-flu-season/617924/ . Last accessed: March 1, 2021.
[ii] The Office of Economic and Demographic Research (EDR) is a research arm of the Florida Legislature principally concerned with forecasting economic and social trends that affect policy making, revenues, and appropriations. http://edr.state.fl.us/Content/
[iii] Please note that the numbers discussed herein are predicated on our ability to avoid economic shutdowns.
![]()