 June 2020 – For approximately 40 years, the Planning Commission has been tracking permit activity in Hillsborough County. Alongside our annual population estimates program, the permit tracking program is one of the Planning Commission’s longest running statistical programs. With 40 years of analysis (including 20 years of spatially enabled data), the Planning Commission maintains a repository of permit data documenting how Hillsborough County, and its municipalities, have grown over time. This permit data has been distributed in a number of different ways such as summary excel tables, newsletters, and GIS files. We are now proud to offer a web-based dashboard for residential permits. This dashboard allows someone to query across jurisdictions, time periods and permit types to conduct the research that they need.
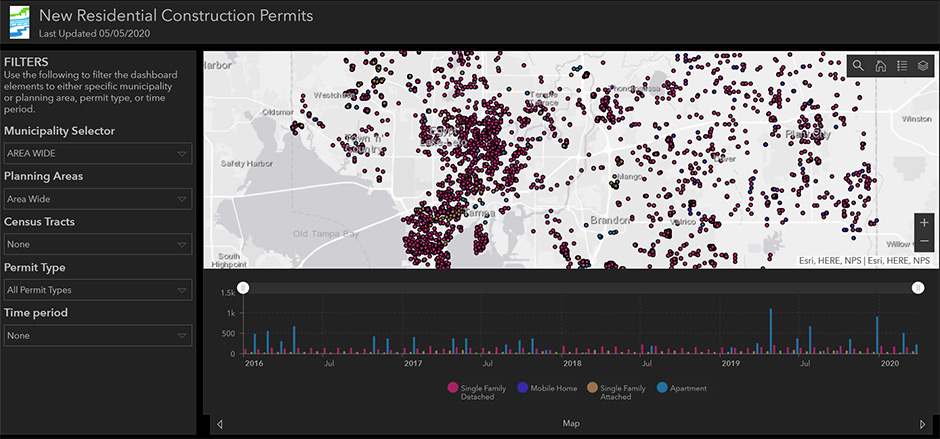
Check out the Residential Permits Dashboard
The dashboard provides a rich and detailed user experience. It utilizes a simple interface capable of answering questions, such as what type of structure is being built at a given address, to more complex questions based on building type, time period or planning area. Among the unique features this dashboard provides are the following:
- Permit analysis by jurisdiction (e.g. City of Tampa, Temple Terrace, Plant City, or Hillsborough County). While the default setting is for areawide, analysis can be limited to each of the four jurisdictions.
- Permit analysis by planning area for Unincorporated Hillsborough County (e.g. areas such as Brandon or Town ‘N Country can be researched)
- Permit analysis by type of permits such as Single Family Detached, Apartments or others can be researched.
- The time query tool allows data to be analyzed by specific date ranges from 2016 to the most recent quarter. Individual dates can be queried out against the universe of permit data.
- Advanced users can take advantage of the Census Tract filter to analyze permit trends on specific Census Tracts of interest.
Many of these tools can be used in conjunction with another. For example, it is easy for a user to analyze permit trends in the City of Tampa for a given period of time and focus exclusively on apartment trends.
For those who prefer a quick snapshot of permit activity, there are a series of tabs along the bottom of the dashboard. These tabs summarize permitting activity by planning area and jurisdiction. These tabs are static and are unaffected by choices made on other parts of the dashboard. They are intended to communicate the most commonly requested data regarding permits with minimum effort on the part of the requestor. With this new tool, most users should be able to identify the permit data relevant to their interests. It is anticipated in a future release of this dashboard, users will be able to download tables and maps as part of their analysis.
If you have questions about the Residential Permits Dashboard, contact Terry Eagan at eagant@plancom.org or 813/273.3774 ext. 349.
![]()