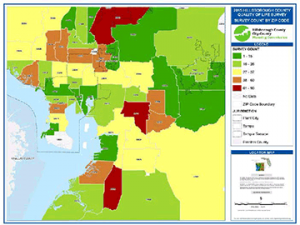
The Quality of Life Survey began in 2002 to measure public perception of the quality of life in Hillsborough County. The Survey was designed by a statistical consultant and is now in its twelfth year. For consistency, the Survey has not been modified over time and uses eighteen factors chosen and ranked by a focus group of County residents. It was their consensus that these eighteen factors represent the quality of life in Hillsborough County. Staff also included an Overall Quality of Life factor to capture any other factors of importance to residents.
The universe from which the sample for the Survey was drawn is the list of registered voters in Hillsborough County as of October 2015 — 772,443 registered voters. Given the size of the universe, 1,000 completed surveys were needed to reach the desired confidence level of 95 percent. A random sample of 20,000 registered voters was mailed surveys during the first week of January 2016. More than 1,800 completed surveys were returned. This year we also chose to analyze how public perception has changed from the peak of the economic boom to the post recession and recovery period. To measure the change in perception, this year’s factor scores were compared with factor scores from the 2005 Survey.

